Live a richer life. Independent financial guidance for smarter decisions.

Advertiser Disclosure

Search results for: “index fund”

  • Build a Three-Fund Portfolio: Beginner’s Guide

    Build a Three-Fund Portfolio: Beginner’s Guide


    How to Build a Three-Fund Portfolio: A Step-by-Step Guide for Beginner U.S. Investors

    Most beginner investors overcomplicate their portfolios. They buy a dozen funds, track performance obsessively, and still underperform the market. The three-fund portfolio solves that problem with a strategy so simple it fits on an index card: one U.S. stock fund, one international stock fund, one bond fund. That’s it.

    This guide walks through exactly how to build a three-fund portfolio in 2026—what to buy, how much to allocate, which brokerages to use, and how to maintain it with minimal effort. Specific fund tickers, expense ratios, and allocation examples are included throughout.

    Disclosure: This article is for informational purposes only and does not constitute personalized financial, tax, or legal advice. Consult a qualified financial professional before making investment decisions.

    What Is a Three-Fund Portfolio and Why Beginners Love It

    A three-fund portfolio is a self-managed investment strategy built from just three broad index funds: a U.S. total stock market fund, a total international stock market fund, and a total U.S. bond market fund. It’s sometimes called a lazy portfolio because it requires almost no ongoing management after setup.

    The strategy is rooted in Boglehead philosophy, named after Vanguard founder John Bogle. The core idea: instead of trying to pick winning stocks or time the market, own the entire market at the lowest possible cost. That approach has historically outperformed the majority of actively managed mutual funds over multi-decade periods, largely because active fund managers charge higher fees and rarely beat their benchmark indexes consistently.

    A three-fund portfolio eliminates several categories of risk that plague more complex portfolios:

    • Individual stock risk: No single company collapse tanks your portfolio.
    • Sector risk: You’re not overexposed to tech, energy, or any other single industry.
    • Fund manager risk: Index funds track a benchmark mechanically—there’s no manager making decisions that can drift from your strategy.
    • Overlap: Each of the three funds covers a distinct asset class with minimal redundancy.

    The result is a globally diversified, low-cost portfolio that captures broad market returns. For the vast majority of long-term investors, that’s a better outcome than trying to beat the market.

    The Three Core Asset Classes: What You’re Actually Buying

    Before selecting specific funds, understand what each component does and why it belongs in the portfolio.

    1. U.S. Total Stock Market Fund

    This fund invests in virtually every publicly traded U.S. company—large, mid, and small cap. Unlike an S&P 500 fund, which covers only the 500 largest companies, a total market fund includes approximately 3,500–4,000 stocks. You’re buying ownership stakes in companies across every sector of the U.S. economy.

    Common examples: VTSAX (Vanguard, expense ratio: 0.04%), FSKAX (Fidelity, 0.015%), SWTSX (Schwab, 0.03%), VTI (Vanguard ETF, 0.03%)

    2. Total International Stock Market Fund

    This fund covers developed and emerging markets outside the United States. That includes companies in Europe, Japan, Canada, Australia, China, India, Brazil, and dozens of other countries. Adding international exposure reduces your dependence on the U.S. economy and captures growth in markets that don’t always move in lockstep with domestic stocks.

    Common examples: VTIAX (Vanguard, 0.11%), FTIHX (Fidelity, 0.06%), SFILX (Schwab, 0.06%), VXUS (Vanguard ETF, 0.07%)

    3. Total U.S. Bond Market Fund

    This fund holds a broad mix of U.S. government and investment-grade corporate bonds across various maturities. Bonds typically move differently from stocks—when equity markets fall sharply, bonds often hold their value or rise, cushioning portfolio losses. They also generate regular income through interest payments.

    Common examples: VBTLX (Vanguard, 0.05%), FXNAX (Fidelity, 0.025%), SWAGX (Schwab, 0.04%), BND (Vanguard ETF, 0.03%)

    Each fund is a passive index fund or ETF. Expense ratios across all three funds range from 0.015% to 0.11% annually—a fraction of the 0.5%–1.0% charged by many actively managed funds.

    Asset Allocation: Finding Your Ideal Mix

    Choosing how much to put in each fund is more important than which specific fund you pick. Asset allocation—your percentage split between stocks and bonds—drives the majority of your long-term returns and determines how much your portfolio will swing during downturns.

    The Age-in-Bonds Rule

    The classic Boglehead starting point: hold your age as a percentage in bonds. A 30-year-old holds 30% bonds and 70% stocks. A 55-year-old holds 55% bonds and 45% stocks. This rule automatically shifts you toward stability as you approach retirement.

    Some investors find this too conservative for younger ages. An alternative is “age minus 10” or “age minus 20” in bonds, allowing for higher stock exposure early on.

    Sample Allocations by Risk Profile

    Profile U.S. Stocks International Stocks Bonds Best For
    Aggressive 70% 20% 10% Investors in their 20s–30s with high risk tolerance
    Moderate 60% 20% 20% Investors in their 30s–40s with a 20+ year horizon
    Conservative 50% 10% 40% Investors within 10 years of retirement
    Near-Retirement 30% 10% 60% Retirees prioritizing capital preservation

    How Much International Exposure?

    Vanguard’s research has historically suggested 20%–40% of equity in international stocks. John Bogle himself recommended capping international at 20% of the equity portion. A practical middle ground used by many investors: keep international at roughly 20%–30% of total stock allocation. For a portfolio with 80% in stocks, that means 16%–24% in international funds.

    Three key factors should drive your final allocation:

    • Time horizon: More years until you need the money = more capacity to ride out stock volatility.
    • Risk tolerance: If a 30% portfolio drop would cause you to sell, reduce your stock percentage now rather than panic later.
    • Financial goals: Retirement in 35 years calls for a different mix than a house down payment in 7 years.

    Step-by-Step Implementation: From Account Opening to First Trade

    Building a three-fund portfolio is a five-step process. Most investors can complete it in under an hour.

    Step 1: Choose a Brokerage Platform

    All three major platforms—Vanguard, Fidelity, and Charles Schwab—offer commission-free trading on their own index funds and ETFs. M1 Finance is another option with automated rebalancing features. There’s no fee advantage of one over another for a basic three-fund setup.

    If you’re a beginner with no strong preference, Fidelity is a practical first choice: it has no account minimums, zero-expense-ratio index funds (FZROX, FZILX), and an easy-to-navigate interface.

    Step 2: Open the Right Type of Account

    Account type matters as much as fund selection. In order of tax efficiency:

    • 401(k) or 403(b): Contribute at least enough to get your employer match—that’s a guaranteed 50%–100% return on that portion. Then evaluate fund options inside the plan.
    • Roth IRA: Contributions are post-tax; withdrawals in retirement are tax-free. The 2026 contribution limit is $7,000 ($8,000 if you’re 50+). Ideal for younger investors expecting higher future tax rates.
    • Traditional IRA: Contributions may be tax-deductible; withdrawals taxed as ordinary income. Same limits as Roth IRA.
    • Taxable brokerage account: No contribution limits, but dividends and capital gains are taxable annually. Use after maxing tax-advantaged accounts.

    Step 3: Research and Select Your Three Funds

    Use your brokerage’s fund search tool. Search for “total stock market,” “total international,” and “total bond market.” Verify that each fund:

    • Tracks a broad market index (not a sector or style-specific index)
    • Has an expense ratio below 0.20%
    • Has sufficient assets under management (generally $1 billion+ for stability)

    Step 4: Determine Your Allocation Percentages

    Based on your age and risk tolerance from the table above, decide on your target percentages before placing any trades. Write them down. This becomes your reference point for future rebalancing.

    Step 5: Make Your Initial Investment

    You have two approaches:

    • Lump sum: Invest all available capital at once. Research consistently shows lump-sum investing outperforms dollar-cost averaging roughly two-thirds of the time, because markets trend upward over time.
    • Dollar-cost averaging (DCA): Invest a fixed amount on a set schedule (weekly, bi-weekly, or monthly). This is more psychologically manageable for large sums during volatile markets.

    Set up automatic contributions immediately after your first investment. Automation removes the behavioral temptation to delay or skip contributions during downturns.

    Specific Fund Examples by Provider

    Below are complete three-fund portfolio bundles by brokerage. All expense ratios are approximate as of early 2026—verify current ratios on each fund’s prospectus before investing.

    Vanguard

    Fund Ticker Type Expense Ratio
    Total Stock Market ETF VTI ETF 0.03%
    Total International Stock ETF VXUS ETF 0.07%
    Total Bond Market ETF BND ETF 0.03%

    Mutual fund equivalents: VTSAX / VTIAX / VBTLX (minimum $3,000 per fund for Admiral Shares).

    Fidelity

    Fund Ticker Type Expense Ratio
    Total Market Index Fund FSKAX Mutual Fund 0.015%
    Total International Index Fund FTIHX Mutual Fund 0.06%
    U.S. Bond Index Fund FXNAX Mutual Fund 0.025%

    Fidelity also offers zero-expense-ratio index funds FZROX (U.S. total market) and FZILX (international), though these can only be held at Fidelity.

    Charles Schwab

    Fund Ticker Type Expense Ratio
    Total Stock Market Index Fund SWTSX Mutual Fund 0.03%
    International Index Fund SFILX Mutual Fund 0.06%
    U.S. Aggregate Bond Index Fund SWAGX Mutual Fund 0.04%

    Can You Mix Funds From Different Providers?

    Yes. A portfolio holding FSKAX (Fidelity), VXUS (Vanguard), and BND (Vanguard) is perfectly functional. The goal is three non-overlapping index funds covering each asset class—not loyalty to a single company. That said, keeping all three at one brokerage simplifies account management.

    What About Target-Date Funds?

    Target-date funds (e.g., Vanguard Target Retirement 2055) hold a similar mix of assets and automatically shift toward bonds as the target date approaches. They’re simpler but typically charge slightly higher fees (0.08%–0.15%) and offer less control over your exact allocation. They’re a legitimate one-fund alternative if you want the strategy with zero maintenance.

    The Two Maintenance Tasks: Automate and Rebalance

    Once your portfolio is set up, ongoing management comes down to two tasks. Neither requires significant time or expertise.

    Task 1: Automate Contributions

    Set up automatic monthly or bi-weekly transfers from your checking account to your investment account. Most brokerages allow you to split contributions automatically across funds according to your target percentages.

    Dollar-cost averaging through automated contributions does two things: it ensures you invest consistently regardless of market conditions, and it eliminates the behavioral trap of waiting for a “better time” to invest. Time in market consistently outperforms attempts to time the market.

    Task 2: Rebalance Once a Year

    Over time, the portions of your portfolio that perform well grow larger than your target allocation, and the laggards shrink. Rebalancing brings everything back to your target percentages.

    A practical rebalancing rule: check your allocation once a year, and rebalance if any asset class has drifted more than 5 percentage points from its target. For example, if your target is 60/20/20 but your U.S. stocks have grown to 70%, sell enough to bring it back to 60% and redistribute the proceeds to the underweight funds.

    Rebalancing inside a tax-advantaged account (401k or IRA) carries no immediate tax consequence. In a taxable account, selling appreciated assets generates capital gains taxes—so consider directing new contributions toward underweight funds first before selling anything.

    Key behavioral principle: Do not sell during market downturns. Historical data shows that major market indexes—including periods covering the 2000 dot-com crash, the 2008–2009 financial crisis, and the 2020 COVID crash—have recovered and reached new highs in subsequent years. Emotional selling during downturns locks in losses and removes you from the recovery.

    Common Beginner Mistakes to Avoid

    Buying Overlapping Funds

    One of the most frequent errors: holding both a total stock market fund and an S&P 500 fund simultaneously. The S&P 500 makes up roughly 82% of the total U.S. market by market cap. Owning both gives you massive redundancy without additional diversification. Pick one: total market (preferred for broader small-cap exposure) or S&P 500 (acceptable substitute, especially in 401(k)s where total market options may not exist).

    Chasing Recent Performance

    U.S. stocks dominated for most of the 2010s. International stocks have had periods of outperformance both before and during different economic cycles. Shifting your allocation based on last year’s returns is a documented way to buy high and sell low. Stick to your predetermined allocation.

    Holding Too Much Cash

    An emergency fund of 3–6 months of expenses in a high-yield savings account is appropriate. Beyond that, excess cash sitting in a savings account loses purchasing power to inflation. Once the emergency fund is established, deploy remaining investable capital according to your target allocation.

    Ignoring Expense Ratios

    A 1% annual fee versus a 0.05% fee may seem trivial on a $10,000 portfolio. Over 30 years at 7% average annual returns, the difference compounds to approximately 25% less total wealth. On a $10,000 starting investment with no additional contributions, a 1% fee portfolio grows to roughly $57,000 versus $74,000 for a 0.05% fee portfolio. The math is unambiguous: keep costs as low as possible.

    Using a Taxable Account When Tax-Advantaged Space Is Available

    Max out your 401(k) at least to the employer match, then your IRA, before investing in a taxable brokerage account. Capital gains and dividends in a taxable account create an annual tax drag that compounds significantly over decades. The 2026 IRA limit is $7,000; the 401(k) employee contribution limit is $23,500 (plus $7,500 catch-up for those 50+).

    Overcomplicating the Strategy

    Adding a fourth, fifth, or sixth fund to “improve” a three-fund portfolio is usually counterproductive. Sector funds, REIT funds, dividend funds, and factor ETFs all introduce complexity and often overlap with your existing holdings. The three-fund portfolio works precisely because of its simplicity—resist the urge to tinker.

    What to Do Next: Your Action Steps This Week

    The three-fund portfolio only works if you actually build it. Here are five concrete steps to complete within the next seven days:

    1. Open a brokerage account at Vanguard, Fidelity, or Charles Schwab if you don’t already have one. All three offer online account opening that takes 5–10 minutes. If your employer offers a 401(k), log in and check your fund options—most offer at least one total market or S&P 500 index fund.
    2. Calculate your target allocation. Start with the age-in-bonds rule as a baseline, then adjust up or down based on your actual risk tolerance. Write down your three target percentages before selecting any funds.
    3. Select your three index funds. Use the fund tables above as a starting point, verify current expense ratios on each fund’s prospectus page, and confirm each fund covers its intended asset class. Aim for combined expenses of 0.03%–0.10% annually.
    4. Make your first investment. Either invest a lump sum or set up automatic monthly contributions. A $100 automatic monthly contribution is better than waiting until you have a “meaningful” amount—consistency matters more than the starting size.
    5. Set a single annual calendar reminder to rebalance. Pick a date—your birthday, January 1, or any other memorable date. Check your allocation once, adjust if needed, and leave it alone for another year. Then let time and compounding do the work.

    The three-fund portfolio’s power comes not from sophistication but from discipline. Low costs, broad diversification, consistent contributions, and emotional restraint during downturns are the four variables that determine long-term outcomes. All four are within your control from day one.

  • Series I Bonds vs. High-Yield Savings: 2026 Emergency Fund

    Series I Bonds vs. High-Yield Savings: 2026 Emergency Fund

    Series I Bonds vs. High-Yield Savings Accounts in 2026: Where to Park Your Emergency Fund Right Now

    With inflation hovering around 3% and Federal Reserve policy still in flux as of March 2026, where you park your emergency fund is not a trivial decision. The wrong choice can cost you real purchasing power—or worse, leave you scrambling for cash when you need it most.

    Two safe, government-backed options dominate this conversation: Series I Savings Bonds and high-yield savings accounts (HYSAs). Both protect your principal. Both beat traditional savings accounts. But they work in fundamentally different ways, and only one is actually suited for emergency savings.

    This article breaks down exactly how each vehicle works in 2026, compares them head-to-head, and gives you a clear action plan based on your situation.

    Disclaimer: This article is for informational purposes only and does not constitute personalized financial, tax, or legal advice. Consult a qualified advisor before making investment decisions.


    Why This Decision Matters: Emergency Fund Basics First

    The standard emergency fund rule is straightforward: keep three to six months of essential living expenses in a liquid, safe account. “Liquid” means you can access the money within days—not weeks, not months.

    That constraint immediately creates a problem for Series I Bonds. And it’s why understanding the structural differences between these two options before you move any money is essential.

    Here’s the quick version of what separates them:

    • High-yield savings accounts currently offer 4.0%–4.5% APY at leading online banks, with no lockup period and FDIC insurance up to $250,000.
    • Series I Bonds combine a fixed rate with a semiannual CPI-linked inflation adjustment, but impose a strict 12-month minimum holding period with no exceptions.

    That 12-month lockup is the defining issue. If a job loss, medical emergency, or urgent home repair hits you in month eight, your I Bond money is simply unavailable. That’s not a minor inconvenience—it’s a structural disqualifier for a primary emergency fund.


    How Series I Bonds Work in 2026: Rates, Limits, and the Lockup Problem

    Series I Bonds are U.S. Treasury savings bonds designed to preserve purchasing power over time. They earn interest in two parts: a fixed rate set at the time of purchase that never changes, plus a variable rate tied to the Consumer Price Index (CPI), adjusted every six months in May and November.

    That inflation-adjustment mechanism is the main appeal. If inflation runs hot, your I Bond rate goes up automatically. If inflation cools, your rate adjusts downward—but the fixed component stays locked in for the life of the bond.

    Key Terms and Limits for 2026

    • Purchase limit: $10,000 per person per calendar year in electronic bonds via TreasuryDirect.gov, plus up to $5,000 in paper bonds purchased with your federal tax refund.
    • Minimum holding period: 12 months from purchase—you cannot redeem a single dollar before this window closes, for any reason.
    • Early redemption penalty: If you redeem before five years, you forfeit the last three months of accrued interest. On a $10,000 bond earning roughly 4%, that’s approximately $100 in lost interest—a real cost, not a theoretical one.
    • Tax treatment: Interest is exempt from state and local taxes but is subject to federal income tax. You can defer reporting until redemption or maturity.
    • Maximum term: I Bonds earn interest for up to 30 years.

    The Honest Bottom Line on I Bonds for Emergencies

    The lockup structure makes I Bonds a poor fit as a primary emergency fund vehicle. Bankrate and Thrivent both flag this directly: savings bonds are a solid choice for saving, but the 12-month inaccessibility period disqualifies them from emergency fund duty. The three-month interest penalty on early exit (before five years) adds a financial sting on top of the access problem.

    Where I Bonds shine is as a medium-to-long-term inflation hedge for money you genuinely will not need for at least one to five years.


    High-Yield Savings Accounts: The Actual Emergency Fund Standard in 2026

    High-yield savings accounts at online banks have become the default recommendation for emergency fund storage—and for good reason. They offer competitive rates, instant liquidity relative to alternatives, and the same federal deposit insurance as a big brick-and-mortar bank.

    Current Rates and Access

    • APY range: Leading online banks—including Ally, Marcus, Axos (UFB Portfolio Savings), and LendingClub—are offering 4.0%–4.5% APY as of early 2026. LendingClub’s LevelUp Savings account, for example, offers 4.20% APY for accounts with monthly deposits of at least $250.
    • Transfer speed: Funds typically transfer to a linked checking account within one to three business days. Some banks offer ATM cards for same-day cash access.
    • FDIC insurance: Deposits are insured up to $250,000 per depositor per bank—the same protection as any FDIC-member institution, and equivalent in safety to Treasury bonds for practical purposes.
    • Withdrawal flexibility: Most reputable online banks have eliminated monthly withdrawal caps. You can move money as often as needed with no penalty.
    • Fees: Zero monthly maintenance fees, no minimum balance requirements, and no per-withdrawal charges at top-tier online banks.

    The One Real Risk: Rate Variability

    High-yield savings account rates float with Federal Reserve policy. A 0.25% rate cut by the Fed translates almost immediately into a proportional APY drop at your bank. That’s the tradeoff for liquidity: your rate is not locked in. In contrast, the fixed component of an I Bond rate is guaranteed for the bond’s life.

    That said, in the current environment where you need accessible cash, a variable 4.0%+ APY still beats letting money sit in a traditional savings account earning 0.5% or less.


    Head-to-Head: Series I Bonds vs. High-Yield Savings (2026 Comparison)

    Feature Series I Bonds High-Yield Savings Account
    Current Rate (early 2026) Fixed + CPI variable (combined rate varies) 4.0%–4.5% APY
    Liquidity Locked for 12 months minimum; no exceptions Access within 1–3 business days; ATM cards available
    Early Exit Penalty Forfeit last 3 months of interest if redeemed before 5 years None
    Principal Safety U.S. Treasury backed; cannot lose principal FDIC insured up to $250,000 per depositor per bank
    Rate Structure Semi-annual CPI adjustment; inflation hedge built in Variable; tracks Fed rate changes
    State/Local Tax Exempt Fully taxable
    Annual Purchase Limit $10,000 electronic + $5,000 paper (per person) No limit
    Inflation Protection Strong: CPI-linked variable component Moderate: rate may lag inflation in high-inflation periods
    Best Use Case Medium-to-long term savings (5+ years) Emergency fund; short-term cash reserves

    The table tells a clear story. For emergency fund purposes, the high-yield savings account wins on every liquidity metric. For inflation-hedged savings over a multi-year horizon where you do not need the cash, I Bonds have a structural advantage.


    The Verdict: Why High-Yield Savings Are Your Emergency Fund Choice

    An emergency is, by definition, unpredictable. You cannot schedule a transmission failure, a medical bill, or an unexpected job loss around your I Bond’s 12-month maturity window. The entire point of an emergency fund is that you can access it immediately—without negotiation, without penalty, without waiting.

    Consider a realistic scenario: You purchase $10,000 in I Bonds in April 2026. Seven months later, you’re laid off. Your I Bond is completely inaccessible until April 2027. You’re now forced to use credit cards, drain a retirement account with tax penalties, or borrow from family—all because your emergency fund was in the wrong vehicle.

    The math on early I Bond redemption also punishes you when you’re already in a bad spot. Redeeming a $10,000 I Bond before five years means forfeiting approximately three months of accrued interest. At a 4% composite rate, that’s roughly $100 gone at the moment you can least afford it. The right account for emergency money doesn’t have an exit penalty.

    When I Bonds Do Make Sense

    I Bonds are not a bad product—they’re a mismatched product for emergency fund use. They make clear sense in these situations:

    • You’ve already fully funded a 3–6 month emergency fund in a high-yield savings account.
    • You have surplus savings earmarked for goals three or more years away (a down payment, a future large purchase, supplemental retirement savings).
    • You’re in a high state-tax environment where the state/local tax exemption provides a meaningful yield boost.
    • Inflation is running above 5%, making the CPI-linked variable rate more attractive than fixed HYSA rates.

    The Smart Hybrid Approach: Layering Series I Bonds With Your Emergency Fund

    The most effective strategy for most households is not either/or—it’s a two-layer system that separates the function of each account clearly.

    Layer 1: Emergency Fund in a High-Yield Savings Account

    Calculate your target: multiply your monthly essential expenses (housing, food, utilities, insurance, minimum debt payments) by three to six. For a household spending $5,000/month on essentials, that’s $15,000–$30,000.

    Park that entire amount in a 4.0%+ HYSA at an online bank with no fees and no withdrawal limits. At 4.0% APY, a $25,000 balance earns approximately $1,000 per year in interest—available to you at any time with no conditions attached.

    Layer 2: I Bonds for Medium-Term Inflation-Protected Savings

    Once your HYSA emergency fund is fully funded, begin purchasing $10,000 per year in Series I Bonds via TreasuryDirect.gov. Treat this as a separate savings bucket for goals that are at least three to five years away. Over time, this builds a meaningful inflation-hedged reserve that complements your liquid cash cushion.

    Practical Example: $100,000 Household Income

    • Estimated monthly essential expenses: ~$4,000–$5,500
    • 6-month emergency fund target: $24,000–$33,000
    • Recommended vehicle: High-yield savings account at 4.0%+ APY
    • Estimated annual interest at 4.0%: $960–$1,320
    • After emergency fund is fully funded: Add $10,000/year in I Bonds as a second savings layer

    Rebalancing Your HYSA Rate Over Time

    High-yield savings rates are not static. Check your APY every three to six months. If your current bank’s rate drops more than 0.5% below the market leaders, there is no penalty to move your money to a higher-rate account. Unlike I Bonds or CDs, switching HYSAs costs you nothing except a few minutes of paperwork.


    What to Do Next: Your 2026 Emergency Fund Action Plan

    Here are five concrete steps you can execute right now:

    Step 1: Calculate Your Emergency Fund Target

    Add up your monthly essential expenses: rent or mortgage, utilities, groceries, insurance premiums, and minimum debt payments. Multiply by three (minimum) to six (recommended). That number is your target balance.

    Step 2: Open a High-Yield Savings Account With 4.0%+ APY

    Choose an online bank with no monthly fees, no minimum balance requirement, and no withdrawal limits. As of early 2026, LendingClub, Ally, Marcus, and Axos (UFB) are consistently among the top-rate options. Confirm the APY, fee structure, and FDIC membership before transferring funds.

    Step 3: Fund Your Emergency Account First—Before Anything Else

    Do not open an I Bond account, contribute extra to a brokerage, or pursue any other savings vehicle until your HYSA emergency fund is fully funded. This is non-negotiable. An incomplete emergency fund is a financial vulnerability that every other strategy depends on resolving first.

    Step 4: Once Your Emergency Fund Is Complete, Add I Bonds Annually

    Visit TreasuryDirect.gov, create an account, and purchase up to $10,000 per calendar year in electronic Series I Bonds. Note the purchase date, since the 12-month lockup clock starts from that date. Keep a separate record from your HYSA—these serve different purposes.

    Step 5: Review Your HYSA Rate Every Quarter

    Set a recurring calendar reminder every three months to compare your current APY against published rates at competing online banks. If your rate is more than 0.5% below the market leaders, initiate a transfer. There is no exit penalty and the yield improvement is immediate.


    The Bottom Line

    Series I Bonds and high-yield savings accounts are both legitimate, safe financial tools. The problem is that people often conflate “safe” with “interchangeable for any purpose”—and that’s where the mistake happens.

    For your emergency fund in 2026, the answer is clear: a high-yield savings account at an online bank offering 4.0%–4.5% APY is the right vehicle. It offers FDIC protection, same-week liquidity, no penalties, and competitive returns. Series I Bonds are an excellent complement once your emergency fund is fully established—but they cannot substitute for it.

    Build your liquid safety net first. Then let I Bonds do what they’re actually designed to do: protect purchasing power over the long run.

  • TopStep Trader Review – Get Funded To Trade

    TopStep Trader Review – Get Funded To Trade

    topstep trader reviewAs a proprietary asset investment and funding firm, TopStep Trader offers a membership program in which you set up a simulated investment account for futures trading.

    The company recruits traders who meet specific performance criteria and maintain that performance over a specific amount of time.

    The firm was founded in 2012 by Michael Patek, who began his investment career with $90,000 in capital.

    The platform and simulated trading of stock futures are designed to help you think critically and perform targeted research. By helping you develop these essential investment skills, TopStep Trader is setting you up for a better chance at earning a profit in the stock market.

    TopStep Trader Spotlight

    TOPSTEP TRADER SPOTLIGHT

    topstep trader logo

    Investormint Rating

    4 out of 5 stars

      • Best for Experienced Traders
      • 1500+ Traders Funded
      • Average Weekly Profits $500+

    via TopStep Trader secure site

    Is TopStep Trader Right for You?

    If you have a lot of experience and success as a trader, TopStep Trader may be right for you.

    Since inception, TopStep Trader has funded over 1,500 traders. This is a low number compared to the total number of people who have paid for a subscription to the company’s trading simulator. The average weekly profit of those traders is just under $550.

    However, most of the traders are not active at any given time. This means that a few people, perhaps just a couple of hundred, are reaping big profits while others reap none.

    Also, consider how much time you have to dedicate to watching the market, conducting simulations, buying stocks and making planned trades.

    TopStep Trader could be the right online trading setup for you if you have enough knowledge about publicly traded companies to make successful investments.

    You also need to have a lot of time to commit to the platform. If you can dedicate at least 20 to 30 hours per week on it, TopStep Trader could be right for you.

    In the simulated market environment, you can dedicate as much or as little time as you want to trading.

    TopStep Trader also has forums where you can discuss stocks and companies with other traders. This combination of learning and social connection makes TopStep Trader an enjoyable experience for many budding investors.

    TopStep Trader Products

    TopStep Trader offers several different products to its members. All of those products are situated on their Tradovate platform. This platform features a subscription-based commission model and provides access to futures trading.

    In the simulation section of TopStep Trader, you can trade with any CME Group product.

    Once you are a funded trader, you gain access to the EUREX products. You can continue to use the CME Group products as a funded account holder on TopStep Trader.

    How Does
    TopStep Trader Compare?

    There are a few ways to compare TopStep Trader to its competitors.

    You will interact with the platform a lot, which is why you need to compare TopStep Trader’s to those of the other options. In your simulated TopStep Trader trading account, you choose the starting date, time and fund balance.

    The platform’s performance charts and graphs scale in an unusual way. This can make it difficult for you to view detailed performance graphs, especially if you are accessing the platform on a mobile device’s web browser.

    The performance lines are shown in red and green. Therefore, if you are red-green colorblind, you may have a difficult time viewing the graphs.

    The TopStep Trader market replay feature is not as fancy as what its competitors have to offer.

    Unlike TradingSim, TopStep Trader’s charts lack the feature that allows you to fast forward to any time, and you can only go back in time. 

    The array of asset classes is also smaller on TopStep Trader compared to the competing simulated futures trading platforms like thinkOnDemand.

    TopStep Trader offers four different plans to its members. Its competitors offer two to four plans.

    The competitors of TopStep Trader, like eSignal and NinjaTrader, do not implement a transaction fee. However, TopStep Trader’s commission fees are lower than all of its competitors.

    It is also lower than some of its competitors in the data and platform fees. Overall, TopStep Trader has the lowest total fees. Its competitors typically charge less for monthly memberships.

    How Much Does
    TopStep Trader Cost?

    To participate in TopStep Trader’s simulated accounts in the Combine phase, there is an initial $100 membership fee. 

    There is also a monthly membership fee that varies according to how much money your simulated trading account has.

    If you set up a simulated trading account with $30,000, the monthly membership fee is $150.

    Account Size Monthly Fee
    $50,000 $165
    $100,000 $325
    $150,000 $375

    The fee structure continues with a monthly fee of $165 for an account of $50,000, $325 for an account with $100,000 and $375 for a $150,000 account.

    If you erode your account and need TopStep Trader to reset it, they charge you another $100.

    Fees Per Product

    Chicago Mercantile Exchange$105

    Product Data Fees
    Chicago Board of Trade $105
    NYMEX $105
    COMEX $105

    In addition to these monthly fees, TopStep Trader also charges other fees. The use of CME, CBOT, NYMEX or COMEX products incurs a data fee of $105 per product.

    The EUREX product fee is $69.

    TopStep Trader charges standard exchange fees of $2.36 and regulatory fees of $0.04 per transaction. Each trade also incurs a $0.18 transaction fee.

    TopStep Trader Pros and Cons

    It is ideal for the person with a little money to invest and a lot of time to dedicate to the cause. For many people with the dream to become a millionaire in the stock market, this may be enough to inspire them to join the platform.

    TopStep Trader Pros TopStep Trader Cons
    Great If You Lack Capital: If you have little money to start with, the platform gives you the chance to play with the big guys. Fees: Many members of TopStep Trader feel like the site nickels-and-dimes them with all of the charges*. These fees are in addition to the costs of becoming a member.
    Forced Trading Discipline: The platform forces you to have high standards for your trading. You cannot do well in TopStep Trader by making random guesses and hoping for the best outcome. The platform requires that you do a lot of research on every action that you take. Odds Of Funding: You are unlikely to have your trading account funded. Since the company’s founding in 2012, tens of thousands of people have set up accounts on TopStep Trader. Only a small percentage of them have had their accounts funded.
    Ideal for Traders with Time: If you have time on your hands and want to become a better trader, the platform is an ideal place to hone your trading skills. Poor Performance Penalty: If you do manage to get funded, a drop in your performance could cause you to lose that funding.

    *The site does not guarantee the stability of membership costs or fees, so those expenses could increase at any time. You have to calculate the fees and membership costs yourself in order to compare them to other trading platforms and funds in which you could allocate your money.

    How to Apply for TopStep Trader

    When you are ready to apply for an account on TopStep Trader, there are several steps that you must follow. To begin, you must join as a member. This gives you access to all of the trading simulators. You start in the Trading Combine, which is a real-time simulated futures account. You get to simulate trades based on your own research.

    As you do this, TopStep Trader evaluates your performance and profits. The first step involves demonstrating that you can earn a profit without breaking any of their rules.

    The second step in applying for the TopStep Trader status is demonstrating consistency. Your performance must be consistently profitable over time. This also must be done without breaking any of the TopStep Trader rules.

    How To Get Funded

    To get funded on TopStep Trader, there are additional steps. You must prove your profitability over an extended period of time. You must meet earnings goals for at least 10 days.

    In addition, your account must not exceed the daily limit for loss of earnings, and your account’s balance cannot meet or exceed the trailing maximum drawdown.

    Moreover, the account you manage cannot meet or exceed the TopStep Trader weekly loss maximum, and you cannot hold your position through major economic releases.

    These are defined in the terms of service of TopStep Trader. The last requirement for getting your account funded is following their scaling plan. If you can do all of this for a minimum period of 10 days, you have a chance of getting your account funded.

    Once TopStep Trader funds you, the amount of funding stated is not the actual amount of money that you get to use in your trades and investments.

    If TopStep Trader tells you that your account is funded to $100,000, you are only allowed to use the trailing maximum drawdown before you lose the funding.

    For example, the trailing maximum drawdown on a $100,000 funded account is $5,000 after 10 days of trading. This amount does not increase over time. You get to keep the first $5,000 in profits and 80 percent of your subsequent profits. Keep in mind that your profits are taxable income.

    TopStep Trader
    Review Summary

    On TopStep Trader, you gain experience and practice as a trader. The platform allows you to think critically and empowers you to make informed decisions.

    Your results depend on how much effort and time you put into it. The ability to hone your craft gives you the opportunity to work with TopStep Trader’s capital.

    If you manage to get funded, this enhances your ability to earn a side stream of income through the stock market.

    On the other hand, a funded account through TopStep Trader may necessitate that you spend many more hours per week on their platform.

    If nothing else, TopStep Trader gets you ready to be more hands-on with your investments.

    When you are ready to take some risks and dedicate a considerable amount of free time to the platform, TopStep Trader could be your ticket to extra money.

  • Round Review – Access World Class Fund Managers

    Round Review – Access World Class Fund Managers

    round review

    InvestorMint provides personal finance tools and insights to better inform your financial decisions. Our research is comprehensive, independent and well researched so you can have greater confidence in your financial choices.

    If you’ve ever been lost trying to decide where to invest your money, Round is an investment app worth checking out.

    The latest stats show 9,599 mutual funds exist. And if you’re like most people, you probably don’t know how to separate the wheat from the chaff. That’s where Round comes to the rescue.

    Round isn’t some run-of-the-mill robo-advisor that deposits your money into a handful of passive ETFs. Instead, Round sifts through the mutual fund maze to identify the best of the bunch.

    Your money is then allocated to a collection of these top-performing funds by Round, who provides one of the very best visual interfaces of any investment app, allowing you to easily see where and how much of your money is invested in each fund.

    Round Investment App

    ROUND SPOTLIGHT
    round logo

    InvestorMint Rating

    4.5 out of 5 stars

    • Human Investors Manage Money
    • Custom Tailored Portfolios
    • Affordable Investment Management

    via Round secure site

    Why You Need Round

    Unless you’ve got the predictive powers of Nostradamus, chances are you don’t know where the stock market is headed next.

    And while you could allocate your money to a robo-advisor who will probably spread your hard-earned nest-egg across a bunch of exchange-traded funds, the reality is your chances are slim of outperforming the market using that strategy.

    But what if you could hand-pick the best performing asset managers who have long track records of thriving from one economic cycle to the next?

    Enter Round.

    Round is led by Saul Cohen, an experienced investor who comes from the institutional investment world.

    Already, a distinguished list of funds have made the cut. Names you probably already know, like PIMCO and Guggenheim, as well as less well-known, but highly respected asset managers, like Highland and GAMCO.

    By allocating your money to top tier fund managers, you move the odds in your favor of outperforming the stock market as opposed to simply riding the wave up and down via standard index funds.

    World-Class Fund Managers

    When you choose Round as your wealth manager, your portfolio is invested with a selection of these world-class fund managers.

    Fund Manager Description
    PIMCO
    • World’s largest bond investor with $1.84 trillion in assets under management (AUM)
    • Specializes in Government Bonds, Corporate Bonds, Agency MBS, and Non-Agency MBS
    • 255+ portfolio managers, 785+ global investment professionals
    GAMCO
    • 40-year track record and $37 billion in AUM
    • Specializes in Merger Arbitrage, Value Stocks, Growth Stocks, Large Company Stocks, and Small Company Stocks
    • 40 person research team led by Mario Gabelli
    DoubleLine
    • Manages $140 billion in assets
    • Specializes in Non-agency MBS, Agency MBS, CMBS, Government Bonds
    • Led by Jeffrey Gundlach – FIASI Fixed Income Hall of Fame and renowned expert on debt-related investments
    Guggenheim
    • Manages $270 billion across stocks, bonds, and alternative strategies
    • Specializes in Leveraged Loans, Aircraft ABS, High-yield Bonds, Municipal Bonds, Collateralized Loan Obligations, Municipal Bonds
    • Scott Minerd, the “Bond King”, is the Chairman of Guggenheim Investments
    All-Star Co-Managed
    • The Liberty All-Star Equity Fund’s investments are co-managed by Aristotle, a value-focused asset manager overseeing $22 billion, Sustainable Growth Advisors managing $9 billion, TCW with $205 billion in AUM, Macquarie with $378 billion in AUM, and Pzena overseeing $32 billion.
    Highland Capital
    • Headquartered in Dallas, Texas with $10 billion in assets under management
    • Specializes in Private Equity, Distressed Investing, CLOs and High-yield Bonds
    Cohen & Steers
    • $62 billion in assets under management
    • Specializes in Real Estate, Infrastructure, and MLPs
    • 22 senior investment professionals
    Aberdeen
    • Over $643 billion in assets under management
    • 1,000+ investment professionals
    • Emerging Market Stocks
    Brookfield
    • $365 billion in assets under management
    • Specializes in Real Estate, Infrastructure, and MLPs
    • CEO Bruce Flatt leads a team of over 750 investment professionals

    Oh, And Here’s The Kicker

    If you’re like most people, paying for performance makes sense. The flipside is paying for poor performance makes little sense.

    But that’s not how wealth management fees have historically been structured. In good times and bad, whether your portfolio rises or falls, traditional wealth managers have lined their pockets with generous fees.

    Round is changing all that. The team hasn’t just cleverly re-thought where and how money should be invested but it’s also come up with an innovative fee structure that simply makes sense.

    It works like this. When your portfolio is positive, the annual fee of 0.5% applies. When your portfolio is negative, the fee is waived. *Note performance fees apply or are waived on a monthly basis.

    Keep in mind that mutual fund expense ratios – which are charged at the fund level- still apply as is the case on other platforms.

    How Do Round Fees Compare

    If you invested your money in the past with a traditional financial advisor, an annual fee of 1% wouldn’t have been out of the ordinary. Some charge a little less, some a little more, but 1% is a ballpark average.

    Compared to those human managers, Round is approximately 50% cheaper.

    But how do Round fees compare to the fees charged by robo-advisors? When stacked up against Personal Capital, a leading robo-advisor, Round is still cheaper by about 33%.

    The lower cost robo-advisors like Ellevest and Betterment charge 0.25% for their basic products. And if price is your most important consideration, they won’t disappoint you.

    Where Round stands apart from the pack, however, is its value-added service. Although you pay more, you should theoretically get more too.

    Round’s investment committee – who collectively have over $10 billion in investing experience – don’t simply allocate your money to low-cost ETFs and Vanguard funds, but instead select high quality asset managers who are actively endeavoring to outperform the market.

    How To Get Started

    When you open a Round account, the app asks several questions to generate a portfolio that will help you invest in vehicles designed to reach your goals.

    For example, if you want a safe way to grow your savings, Round may allocate more of your money to funds that invest in high quality fixed-income and stable alternatives like real estate.

    If you want a larger expected ROI and don’t mind accepting more risk, then Round can generate a portfolio that includes funds that invest in merger arbitrage, asset-backed securities and high yield bonds.

    For investors keen to invest like the uber wealthy, KKR’s report on Ultra High Net Worth allocation makes for fascinating reading, and is similar to the asset classes on Round.

    A diversified portfolio at Round may include:

    • Alternative debts
    • Government Bonds
    • Corporate Bonds
    • Municipal Bonds
    • MLPs
    • Value Stocks
    • Growth Stocks
    • High-yield Debt
    • Large Company Stocks
    • Real Estate
    • Small Company Stocks

    Within 3 minutes, you can get started investing with as little as $5.

    The Dangers of Passive Investing

    It’s worth emphasizing that the Round team believes active investing is a better way to invest than a passive approach.

    When you choose Round, you need to know that what you’re signing up to and what your potentially side-stepping.

    If you’re not sure the difference here’s a quick primer.

    Pros and Cons of Passive vs Active Investing

    The merits of passive investing are widely touted as:

    • lower fees;
    • a diversified portfolio that tracks a series of benchmark indices;
    • fewer transactions and hence taxes; and
    • a disciplined approach.

    In recent years, the benefits of a passive investing approach have compelled over $500 billion of capital to shift from active to passive investing.

    So it’s clear where passive is attractive but what are the dangers of passive investing?

    According to Hans Redeker, global head of foreign exchange strategy at Morgan Stanley: “the market will be less well able to react to minor distortions… it is frightening (because) you will not have the active market to stabilize it.

    Translated from financial speak to plain English, when the market falls passive investments could suffer big time. Even famed investor Michael Burry, who foresaw the 2008-9 stock market crash, compared index funds to the sub-prime bubble.

    Active managers can be more nimble and therefore pick and choose how and when money is invested. Passive investors will ride the wave to the peak, but equally will likely ride it all the way to the trough of the economic cycle too.

    The bottom line is Round purposely selects managers who favor an active investing approach. Like any good financial advisor, the team has an eye on risk as much as it has an eye on upside returns.

    Is Round Safe?

    When you open a Round account, your investments and cash are stored with Apex Clearing, a broker-dealer and custodian.

    Accounts are SIPC insured up to $500,000.

    You can learn more about the security of your money here.

    How Round Works

    When you sign up to the App, you will be asked to enter your financial information and your bank account.

    A custom portfolio will be built for you.

    All you need to do is make an initial deposit and add money as you go.

    Where Round Shines

    round build portfolioWhere Round earns top marks is its highly intuitive and easy-to-use mobile interface. It’s a breeze to connect your bank accounts and deposit funds.
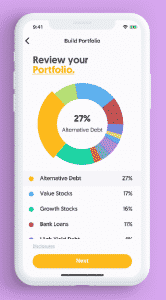


    But more than an investing portal in the palm of your hand, Round shines when it comes to helping you target your financial goals.

    round review portfolio

    You can get started with as little as $5.

    Whether saving to buy a home, preparing for a bigger family, building a retirement nest-egg, putting money aside for a wedding, or taking a trip, Round helps you to keep better financial track.

    You can also view your portfolio allocation in a polished interface that leaves you with no doubts about where your money is invested.

    Round Pros and Cons

    Round Pros Round Cons
    Access World Class Managers: Invest your money with top tier fund managers. Fees: Round charges slightly more than robo-advisors though less than most human financial managers.
    Minimum Account Balance: As long as you deposit at least $5, you can get started with Round. New Investment App: Round is a new investment app so it still has to prove that its human-led investment method performs better over time.
    Custom Portfolios: Round portfolios are tailor-made for you based on your risk tolerance and financial goals.
    In-App & Newsletter Updates: When you sign up to Round, you will receive regular updates both in-app and via email.
    Fee Waiver: If your portfolio loses money on any given month, Round won’t charge you a management fee (*expense ratios still apply).
    Superb Interface: Polished app, highly intuitive, easy-to-see how your money is allocated.

    Invest Round FAQ

    Can you use a credit card to fund your Round account?

    No, you are only permitted to fund your Round account with a checking or savings account.

    What is the minimum account size or deposit?

    The minimum account size is $5.

    How secure is Round?

    Round uses bank-level security, featuring 256-bit encryption and HTTPS Secure Socket Layer certificates. Your social security number and bank / login information is not stored by Round.

    Is Round Safe?

    Your investments are covered up to $500,000 through the Securities Investors Protection Corporation (SIPC). Your money is held in a brokerage account in your own name at Round’s custodian bank, Apex Clearing.

    Round Investments Team

    round team ron rojany
    Ron Rojany
    round team saul cohen
    Saul Cohen

    Round was founded by Saul Cohen and Ron Rojany.

    Saul Cohen worked at Guggenheim Partners, where he was part of a portfolio management team that managed billions of dollars.

    Guggenheim is an award-winning investment firm.

    And he previously worked in investment banking with a focus on financial derivatives.

    Ron Rojany was previously a software engineer at a big data marketing company called Bridg.

    He’s also headed up product development for a health tech company that built hardware and software.

    Round Review Summary

    Round is an investment app that stands out from its rival by giving you access to world class fund managers. Unlike most investment apps, Round doesn’t solely rely on algorithms.

    Instead, it puts your money to work under the guidance of experienced fund managers that can help you reach your financial goals.

    Both conservative investors seeking diversification and risk-seeking investors desiring exposure to alternative asset classes are provided tailor-made portfolios.

    Price sensitive investors will be pleased to learn that Round fees are lower than those charged by most human financial advisors.

    The bottom line is that while Round is a newcomer, it may be a good fit for you if you want access to world class fund managers.

  • Fundrise vs RealtyShares Comparison

    Fundrise vs RealtyShares Comparison

    fundrise vs realtyshares

    Investormint provides personal finance tools and insights to better inform your financial decisions. Our research is comprehensive, independent and well researched so you can have greater confidence in your financial choices.

    In this Fundrise vs RealtyShares comparison, we review fees, investment minimums, geographic diversity, and investment focus so you can make a more informed decision between two of the leading online real estate crowdfunding sites.

    Perhaps the biggest difference right off the bat is you need to be an accredited investor to participate in the offerings by RealtyShares whereas Fundrise is accessible to non-accredited investors.

    If wealth level is not a deciding factor then you will want to consider how long your money is tied up, which states are excluded from coverage, and whether you can invest using your retirement accounts.

    RealtyShares vs Fundrise Comparison

    Real Estate Investing fundrise logo realtyshares logo
    Reviews Fundrise Review RealtyShares Review
    Minimum Investment $500 $5,000
    Dividend Frequency Quarterly Monthly or Quarterly
    Fees 1%
    (annual fees)
    1% → 2%
    (annual fees)
    Commercial
    Residential
    Single Family
    Private REIT
    Geographic Coverage Nationwide Nationwide
    (excluding AK, ND, NV, SD, VT)


    Why Choose RealtyShares or Fundrise

    The major attraction to RealtyShares or Fundrise is the opportunity to invest in real estate versus the stock market.

    For investors who are risk averse or want stable income, online real estate crowdfunding sites are a way to diversify away from the stock market to an asset class that is usually less volatile.

    Whether commercial, residential, or single family homes whet your appetite, both Fundrise and RealtyShares cater to them all.

    History has shown that investing in real estate has been lucrative. Over certain time frames, it’s even eclipsed the performance of the stock market.

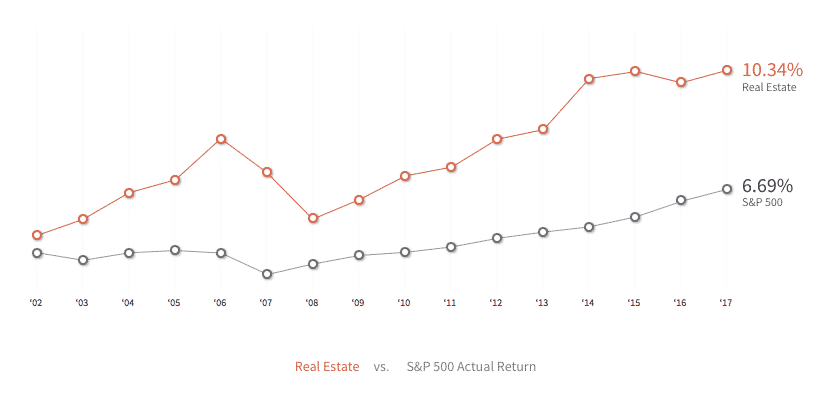
    Research shows that real estate returns between 2002-17 averaged 10.34% annually versus just 6.69% for the S&P 500 index.

    Unless you’re a good stock picker or can scout out high quality dividend-paying stocks, companies like Fundrise and RealtyShares offer a way to earn passive income monthly or quarterly.

    Why Invest Via Crowdfunding Real Estate Sites?

    Commercial Property Features YES/NO
    Tax benefits
    Tangible asset
    Inflation hedge
    Cash flow from day one
    Uncorrelated to stock market
    Investment portfolio diversification
    Passive income
    Buy with leverage

    What Is RealtyShares?

    RealtyShares is a marketplace that connects investors with companies in need of financing for real estate projects.

    Investors pool money together to buy a portion of each real estate project.

    What Is Fundrise?

    Fundrise is an online crowdfunding website that features two main products:

    1. eREIT, which is like a private real estate investment trust
    2. eFund, an investment vehicle used to buy land and property for development

    Both products pool investor monies with a view to gaining exposure to commercial property, residential real estate, or single family homes.

    Fundrise vs RealtyShares
    Minimums

    RealtyShares Investment Minimum

    It’s no surprise that RealtyShares, which is designed for accredited investors with a minimum of $200,000 in income in two consecutive years or $1,000,000 in net worth, has a higher minimum of $5,000.

    In some cases a minimum of just $1,000 is accepted.

    Fundrise Investment Minimum

    The investment minimum at Fundrise is lower, ranging from $500 → $1,000.

    The Fundrise eFund product which pools investor monies, buys land and properties for development, and sells on to residential homeowners has a $500 minimum.

    The eREIT which is more like a private real estate investment trust has a $1,000 investment minimum.

    Fee Comparison

    RealtyShares Fees

    Depending on which RealtyShares product you choose, the fees will range from 1 → 2%.

    On equity investments, the RealtyShares fees are 1% while a 2% interest rate spread on debt is applied.

    Fundrise Fees

    The cost to invest in Fundrise products is capped at 1% annually.


    Fundrise & RealtyShares
    Investment Focus

    RealtyShares Investments

    RealtyShares is a peer-to-peer platform connecting investors to real estate projects in need of financing.

    Some of the highlights of RealtyShares include:

    • Access to residential and commercial property investments
    • Access to private deals across the country, including:
      • Multi-family
      • Offices
      • Fix and flips
    • Deals selected and underwritten by investment professionals

    Fundrise Investments

    Fundrise offers investors exposure to residential real estate investments and commercial real estate investments in its eREIT.

    In its eFund, investors who have an appetite for risk can choose to gain exposure to single family homes.

    Performance Returns

    Fundrise Vs Realty Shares

    Fundrise Returns

    The performance of Fundrise, net of fees, since inception has been:

    Year Fundrise Performance
    2017 11.44%
    2016 8.76%
    2015 12.42%
    2014 12.25%

    RealtyShares Returns

    RealtyShares features a wide variety of investment projects on its platform and returns vary by:

    • Project
    • Geography
    • Offering type
      • Equity
      • Preferred equity
      • Senior debt
    • Asset types
      • Single family homes
      • Retail
      • Multifamily
      • Office

    Fundrise vs RealtyShares
    Comparison

    RealtyShares Wins Fundrise Wins
    Variety of Projects: As a peer-to-peer marketplace, RealtyShares doesn’t buy properties or manage them but connects investors to a wide variety of projects led by experienced, vetted real estate professionals. Low Fees: A management fee of 0.85% and an advisory fee of 0.15% is charged by Fundrise for a total annual fee of 1%.
    Monthly Dividends: Some projects on the RealtyShares platform pay monthly dividends whereas quarterly dividends are paid out at Fundrise. Geographic Exposure: Unlike RealtyShares, which is not available in all states, Fundrise has full nationwide coverage.
    Passive Income: Investors seeking a regular income from investments can find projects that best suit their financial aims among the wide variety of projects. Investment Minimum: The minimum to get started with Fundrise ranges from $500 to $1,000 depending on which product you choose compared with $5,000 at RealtyShares.
    1031 Exchange: You don’t need to own property to qualify to invest in a 1031 exchange that has Federal tax deferral benefits. Non-Accredited Investors: You don’t have to have a swollen bank balance to get started with Fundrise, whereas you will need to be accredited to invest on the RealtyShares platform.
    Returns: The historical returns produced by Fundrise have been impressive and the company is transparent about performance returns.

    RealtyShares vs Fundrise
    Comparison Summary

    Between RealtyShares and Fundrise, the only option is Fundrise for non-accredited investors.

    When it comes to fees and investment minimums, Fundrise also gets the nod. The minimum investment amount at RealtyShares is 10x larger than Fundrise’s eFund product.

    For investors seeking passive income monthly, RealtyShares has projects available to cater to your financial needs whereas Fundrise pays out dividends quarterly.

    Historical returns at Fundrise are transparent and impressive. Plus, Fundrise is available nationwide whereas geographic restrictions are in place when investing with RealtyShares.

    Overall, we award Fundrise the victory but accredited investors should certainly check out RealtyShares.


  • Fundrise vs Realty Mogul Comparison

    Fundrise vs Realty Mogul Comparison

    fundrise vs realty mogul

    Investormint provides personal finance tools and insights to better inform your financial decisions. Our research is comprehensive, independent and well researched so you can have greater confidence in your financial choices.

    We compare Fundrise vs Realty Mogul in this review on key factors like fees, deposit minimums, geographic coverage, and investment focus so you can make a more informed decision about which real estate crowdfunding site best lines up with your financial goals.

    Neither company requires investors to be accredited, so if you don’t have a net worth north of one million dollars, you can still gain exposure to the real estate asset class without having to manage a property day-to-day.

    But which company has lower minimums and which pays you quarterly versus monthly? In this Realty Mogul vs Fundrise review we’ll shine a light on the most important factors to consider before investing a penny.

    Realty Mogul vs Fundrise
    Comparison

    Real Estate Investing fundrise logo realty mogul logo
    Reviews Fundrise Review Realty Mogul Review
    Minimum Investment $500 $1,000
    Dividend Frequency Quarterly Monthly or Quarterly
    Fees 1%
    (annual fees)
    0.3% → 0.5%
    (annual fees)
    Commercial
    Residential
    Single Family
    Private REIT
    Geographic Coverage Nationwide Nationwide


    Why Choose Realty Mogul
    or Fundrise

    If you want to gain exposure to real estate, the old school way was to roll up your sleeves and buy an investment property, whether residential or commercial.

    With the invention of real estate crowdfunding sites like Realty Mogul, Rich Uncles, and Fundrise, it’s much easier these days to diversify your investments beyond the stock market alone.

    And there’s good reason to consider spreading your money across asset classes. According to research from Realty Mogul, real estate returns between 2002-17 averaged 10.34% annually versus just 6.69% for the S&P 500 index.

    realty mogul real estate growth chart

    In general, it is prudent to diversify your investments away from the stock market alone, especially for risk-averse investors.

    While it’s certainly true that stock market returns will beat real estate returns over certain periods, the opportunity for passive income and predictability of cash flows is a key attraction to spread your risk.

    Reasons To Invest In Real Estate?

    Commercial Property Features YES/NO
    Tax benefits
    Tangible asset
    Inflation hedge
    Cash flow from day one
    Uncorrelated to stock market
    Investment portfolio diversification
    Passive income
    Buy with leverage


    Fundrise vs Realty Mogul Minimums

    Realty Mogul Investment Minimum

    The minimum investment amount required by Realty Mogul to get started is $1,000.

    For individuals who want to invest via a self-directed IRA, the investment minimum is $10,000.

    Registered Investment Advisors are required to invest a minimum of $25,000.

    Fundrise Investment Minimum

    At Fundrise, the minimum threshold is lower – it’s just $500 for its eFund product and $1,000 for its eREIT offerings.

    While the Realty Mogul minimum is slightly higher, both online real estate companies make it affordable for investors who would otherwise be tempted otherwise to buy stocks.

    And the costs are vastly lower than the minimum deposits needed to buy property alone. A solo investor would probably need tens of thousands or hundreds of thousands of dollars to buy residential investment properties and perhaps millions to buy commercial real estate investment properties.

    The difference is at Realty Mogul and Fundrise, you don’t actually own property outright as you would if you were a solo investor but rather you own shares of a company, which in turn owns the properties.

    Fundrise Fees vs Realty Mogul Fees

    Realty Mogul Fees

    Compared to many of the best real estate crowdfunding sites, Realty Mogul fees are rock bottom.

    The annual fees charged to investors are between 0.30% → 0.50% and you can expect investments to span anywhere from 6 months to approximately 7 years.

    Fundrise Fees

    Although Fundrise fees are 2x-3x higher – the annual fee is 1% – they are still highly competitive compared to many online real estate platforms.

    Some competitors, like Rich Uncles, charge as much as 3% of invested capital right from the start and tack on additional fees thereafter if you wish to redeem your shares.


    Fundrise & Realty Mogul
    Investment Strategy

    Realty Mogul Investments

    Non-accredited investors are restricted to investing only in MogulREIT I, which is a private REIT that invests in and manages a diversified portfolio of commercial real estate investments.

    Typically, MogulREIT I will invest in a variety of property types, such as:

    • Storage
    • Office
    • Industrial
    • Retail
    • Multifamily

    Fundrise Investments

    The two primary products offered by Fundrise are:

    1. eREIT (an online version of a Real Estate Investment Trust)
    2. eFund (an investment arm that buys land and develops it)

    The investment minimum of $1,000 for the eREIT is higher than for the eFund, which is just $500. eREITs are private REITs that invest in commercial real estate and residential real estate.

    The Fundrise eFund pools investor monies in order to buy land and property that is later sold to residential buyers.

    Fundrise Returns vs
    Realty Mogul Returns

    Fundrise Returns

    Fundrise returns, net of fees, in recent years have been as follows:

    Year Fundrise Performance
    2017 11.44%
    2016 8.76%
    2015 12.42%
    2014 12.25%

    Realty Mogul Returns

    During our research, we were not able to find out historic Realty Mogul returns, however the company does state that risk and return are positively correlated.

    It also points out that the risks of real estate investing include, business risks, financial risks, liquidity risks, and inflation/systemic risk.


    Realty Mogul vs Fundrise:
    Which Is Better?

    Realty Mogul Wins Fundrise Wins
    Low Fees: Annual fees of between 0.30% and 0.50% are charged to investors. Fee Transparency: Fundrise charges a 0.85% annual management fee plus a 0.15% advisory fee.
    Monthly Dividends: Unlike Fundrise, which only pays out dividends quarterly, some investments at Realty Mogul pay monthly dividends. Geographic Exposure: Fundrise has coverage in all 50 states whereas some states are excluded from coverage in the Realty Mogul portfolio.
    Licensed Investment Specialists: Got questions? Realty Mogul has a team of licensed experts available to speak with you. Investment Minimum: It is possible to invest with Fundrise for as low as $500 whereas the minimum is $1,000 at Realty Mogul.
    Passive Income: For anyone needing predictable cash flow each and every month, Realty Mogul is probably the better choice. (Tip: Verify your money is invested in assets that do pay a monthly vs quarterly dividend). Self-directed IRA: Although both companies make it possible to invest via self-directed IRA accounts, the $10,000 minimum at Realty Mogul is high and means Fundrise chalks up the victory in this category.
    1031 Exchange: You don’t need to own property to qualify to invest in a 1031 exchange that has Federal tax deferral benefits. Returns: Fundrise returns are clear and documented over past years whereas we were unable to discern what Realty Mogul returns have been at the time of our research.

    Realty Mogul vs Fundrise
    Comparison Summary

    Price-conscious investors should look first to Realty Mogul which charges lower annual fees than Fundrise. However, the minimum investment amount starts at $1,000 compared to just $500 at Fundrise.

    For investors who value monthly passive income most, Realty Mogul offers the choice between monthly and quarterly dividend payments whereas Fundrise only offers quarterly payouts.

    In terms of transparency, we give the nod to Fundrise who discloses performance returns each year since inception and clarifies succinctly how fees are structured across advisory and management services.

    All in all, both companies earn high marks for lowering the barrier to entry to real estate investing and, in particular, making commercial real estate accessible to non-accredited investors in all 50 states.


  • How Much Are Mutual Fund Expense Ratio Costs?

    How Much Are Mutual Fund Expense Ratio Costs?

    mutual fund expense ratio costs

    InvestorMint provides personal finance tools and insights to better inform your financial decisions. Our research is comprehensive, independent and well researched so you can have greater confidence in your financial choices.

    Whether you are investing your savings in a self-managed brokerage account, a retirement account, such as a 401(k) or IRA, or via a robo-advisor, it is important to know how mutual fund expense ratios affect your portfolio value.

    Mutual fund expense ratio costs are not charged directly to mutual fund shareholders so the casual investor generally pays little attention to them but these costs can substantially erode portfolio returns over time.

    Every mutual fund will charge an expense ratio, so the fees cannot be avoided but you can ensure their impact on portfolio value is diminished by choosing funds with lower expense ratios.

    What Is A Mutual Fund Expense Ratio?

    A mutual fund expense ratio is an annual fee that all funds, including mutual funds and exchange-traded funds, charge to shareholders. These fund expenses are deducted annually and cover operating, management, administrative, and other asset-based costs.

    A mutual fund expense ratio is an annual fee charged to all mutual fund shareholders to cover the fund’s expenses. A mutual fund with a 1% expense ratio will cost you $100 annually for each $10,000 you invest.

    Mutual fund companies are subject to stringent compliance rules and have ongoing expenses to meet compliance standards, operate and manage the fund. The expense ratio is used to pay for other costs too, such as marketing, distribution, record-keeping and administrative.

    The good news as an investor is that mutual fund expense ratios have decreased over time, but you should still pay attention to them because a small percentage fee charged to your invested assets each year can add up to a large amount over time.

    Mutual Fund Expense Ratios Vs. ETF Expense Ratios

    On average, mutual fund expense ratios are higher than ETF expense ratios.

    Generally, mutual fund expense ratios tend to be higher than ETF (exchange-traded funds) expense ratios.

    Exchange-traded funds simply track an index, such as a commodity or bond index, whereas mutual funds are generally more actively managed by mutual fund managers, and so have higher expense ratios.

    Mutual funds and exchange-traded funds typically have fixed costs so funds with fewer assets often have higher expense ratios. For the most part, exchange-traded funds don’t charge expense ratios above 2.0% of assets, though mutual fund expense ratios can run higher.

    Pro Tip: When comparing expense ratios of funds, be sure to examine funds in the same class. For example, compare mutual funds with small cap exposure to other small cap mutual funds.

    Pick Low Expense Ratio Funds

    In general, you should aim to find funds with expense ratios below 1.0%. This is especially true if you are working with a traditional financial advisor as opposed to a robo-advisor because human financial advisors will generally charge an additional 1.0% or more to manage your assets.

    Quickly, you can see how fees add up to a large percentage of your assets. For example, if you squirrel away $500,000 for retirement and pay 2% annually to cover management fees to a financial advisor and mutual fund expense ratios, costs add up to $10,000 annually.

    If your portfolio is increasing quite a bit in value each year, those costs can be absorbed but when markets turn lower as they inevitably do from time to time, those fees can really hurt your bottom line. So how you can you lower the impact of fees?

    How To Lower Fees: Choose A Robo-Advisor

    Robo-advisors will generally pass on expense ratios to clients but they usually select lower fee exchange-traded funds in portfolios and charge lower management fees than traditional financial advisors.

    For the hands-off investor who is not keen to manage their own portfolio, a robo-advisor is a good option to lower fees. Although most robo-advisors will pass on expense ratio costs, they generally use exchange-traded funds with lower expense ratios when constructing portfolios. Plus, robo-advisor management fees tend to be lower than those charged by traditional financial advisors.

    Among the lowest fee robo-advisors are WealthfrontEllevest and Betterment. Both offer free portfolio management up to the first $10,000 and both charge a management fee of 0.25% thereafter for basic services, which compares favorably to the 1%+ management fees charged by most human financial advisors.

    betterment

     
    wealthfront brokerage trading system robo advisor

    How Do I Find Out How Much Expense Ratios Cost?

    For accurate expense ratio comparisons, examine the charges of funds in the same category. For example, compare the expense ratios charged by a high-yield funds with the average charges of high-yield funds in the Investment Company Institute table below, and not with say an emerging market equities fund or a municipal bond fund.

    Each mutual fund has a prospectus that discloses the fees it charges. Major financial publications, such as the Wall Street Journal, also publish expense ratios.

    The average expense ratio paid by investors is called the asset-weighted average expense ratio because it gives more weight to larger funds in order to more accurately represent what investors pay.

    A study conducted by the Investment Company Institute reported the following fund expenses by investment objective:

    Fund Type and Investment Objective Asset-weighted Average Expenses
    Equity Funds 0.74%
    Blend 0.50%
    Growth 0.85%
    Value 0.83%
    Emerging Markets 1.08%
    Alternative Strategies 1.34%
    Hybrid Funds 0.80%
    Bond Funds 0.61%
    Municipal 0.57%
    High-Yield 0.81%
    Investment Grade (short-term) 0.43%
    Investment Grade (intermediate & long-term) 0.48%
    Mortgage-Backed 0.50%
    Inflation-Protected 0.42%
    Money Market Funds 0.17%

    When you compare expense ratios of mutual funds, make sure not to compare actively-managed mutual fund expense ratios to passively-managed exchange-traded fund expense ratios. Actively managed mutual funds usually charge higher expense ratios.

    Similarly, it’s best to compare funds of the same category with each other, for example the expenses ratios charged by emerging market funds should be compared with each other not with a municipal bond fund.

    What Is The Impact Of Expense Ratios On Portfolio Value?

    Small differences in expense ratio fees can seem unimportant but have a huge effect on your overall portfolio value over time. For example, the difference between a 0.50% and a 2.00% fee charge on a $100,000 portfolio that grows at 8% annually over 30 years is over $300,000.

    From the table below, you can see the impact of expense ratio fees on a $100,000 portfolio invested with an average annual gain of 8% over 30 years.

    The difference between a charge of 0.50% and a charge of 2.0% over that 30 year time frame is over $300,000 in portfolio value. So, while it’s easy to neglect small fee differences, the impact over time of just a small percentage fee change is a very large difference in your portfolio value.

    Expense Ratio
    Year Annual Gain (8%) 0.50% 1.00% 1.50% 2.00%
    0 $100,000 $100,000 $100,000 $100,000 $100,000
    1 $108,000 $107,500 $107,000 $106,500 $106,000
    2 $116,640 $115,560 $114,485 $113,415 $112,350
    3 $125,971 $124,222 $122,488 $120,771 $119,070
    4 $136,049 $133,529 $131,045 $128,595 $126,180
    5 $146,933 $143,532 $140,193 $136,917 $133,702
    6 $158,687 $154,279 $149,974 $145,768 $141,660
    7 $171,382 $165,828 $160,429 $155,180 $150,078
    8 $185,093 $178,238 $171,605 $165,187 $158,980
    9 $199,900 $191,571 $183,551 $175,828 $168,395
    10 $215,892 $205,897 $196,319 $187,141 $178,350
    11 $233,164 $221,290 $209,965 $199,168 $188,875
    12 $251,817 $237,827 $224,550 $211,952 $200,002
    13 $271,962 $255,594 $240,136 $225,540 $211,763
    14 $293,719 $274,682 $256,790 $239,981 $224,193
    15 $317,217 $295,188 $274,587 $255,328 $237,329
    16 $342,594 $317,217 $293,602 $271,635 $251,209
    17 $370,002 $340,881 $313,918 $288,962 $265,873
    18 $399,602 $366,302 $335,622 $307,370 $281,363
    19 $431,570 $393,608 $358,809 $326,925 $297,725
    20 $466,096 $422,939 $383,578 $347,697 $315,004
    21 $503,383 $454,443 $410,035 $369,759 $333,251
    22 $543,654 $488,282 $438,293 $393,189 $352,516
    23 $587,146 $524,626 $468,474 $418,070 $372,853
    24 $634,118 $563,661 $500,705 $444,489 $394,320
    25 $684,848 $605,583 $535,125 $472,537 $416,976
    26 $739,635 $650,605 $571,879 $502,313 $440,883
    27 $798,806 $698,955 $611,124 $533,920 $466,108
    28 $862,711 $750,878 $653,024 $567,467 $492,718
    29 $931,727 $806,634 $697,757 $603,069 $520,786
    30 $1,006,266 $866,507 $745,511 $640,848 $550,388

    Most investors working with a traditional financial advisor will pay north of 1% in management fees. A good financial advisor will endeavor to select when possible mutual funds and exchange-traded funds with expense ratios less than 1% – typically these expense ratios are greater than 0.50%.

    For most investors who pay over 1% in management fees and somewhere between 0.50% and 1.0% in expense ratios, the total annual cost of fees will be in the 1.5% to 2.0% range.

    Portfolio growth over time experiences friction from these fees and hurts long-term portfolio value. For example, a $100,000 portfolio that incurs total fees of between 1.50% to 2.00% grows to a value of between $550,000 and $650,000 excluding taxes.

    Lower Fees With No-Commissions Funds

    Charles Schwab and Vanguard offer an extensive lineup of commission-free ETFs to clients.

    With increasing competition among brokers, the race to provide ever more commission-free exchange-traded funds has been a boon for customers. Charles Schwab and Vanguard offer the largest selection of commission-free exchange-traded funds.

    Schwab provides over 200 commission-free ETFs and Vanguard offers clients over 50 commission-free ETFs.

    CHARLES SCHWAB SPOTLIGHT
    charles schwab

    InvestorMint Rating

    4.5 out of 5 stars

      • Promo: Get up to $500 cash with a deposit of $100,000+
      • Account Minimum: $1,000
      • Commissions: $4.95

    Expense Ratios: The Nuts And Bolts & 12b-1 Fees

    The largest component of a mutual fund’s expense ratio is generally its management fee but 12b-1 fees that relate to the costs of marketing and distribution can run as high as 1% annually.

    Expense ratios are made up primarily of management fees paid to the fund’s investment manager or advisor. Other operating costs are included in expense ratios too, including:

    • Accounting fees
    • Auditing fees
    • Custodial services
    • Legal expenses
    • Taxes
    • Recordkeeping

    If you have worked with a financial advisor in the past, you might have stumbled upon something called a 12b-1 fee. This fee also falls under the umbrella of expense ratio charges and is part of a mutual fund’s operating expenses. It is separate from any management fees charged and relates to the cost of marketing the fund.

    12b-1 fees can run as high as 1% annually, and are generally divided among marketing and distribution expenses, and service fees.

    These 12b-1 fees and other fees that form the expense ratio are not broken out as a separate charge to mutual fund shareholders. Instead, expense ratios charged by a mutual funds are factored into its daily Net Asset Value (NAV).

    What Other Fees Are Charged In Addition to Expense Ratios?

    Sales charges are applied to some mutual funds. Depending on whether the sales charges are applied at purchase, sale or ongoing they are categorized as Class-A, Class-B or Class-C shares respectively.

    Other fees in addition to management fees and expense ratios can impact your portfolio’s performance. For example, brokers, financial planners and investment advisors are paid a commission called a sales charge when you invest in a mutual fund.

    Sales charges can be no higher than 8% by law but often range between 3-5%. Funds that have sales charges fall into three classes: A, B and C shares.

    The sales charge for Class-A shares is charged at the time you purchase a mutual fund and is called a front-end load.

    Class-B shares require payment of the sales charge when shares are sold. This is called a back-end load.

    An ongoing sales charge, which tends to be lower than Class-A or Class-B sales charges, is applied to Class-C shareholders on an ongoing basis.

    >> Discover How To Diversify Your Portfolio Intelligently

    >> Read 21 Legendary Investing Quotes

    >> Learn The Best Options Trading Strategies

  • What Are The 7 Best Vanguard Funds?

    What Are The 7 Best Vanguard Funds?

    vanguard funds financial advisor discussion

    InvestorMint provides personal finance tools and insights to better inform your financial decisions. Our research is comprehensive, independent and well researched so you can have greater confidence in your financial choices.

    vanguard investmentsVanguard is best known for low-fee index funds and ETFs that track stock and bond market benchmarks, enabling regular investors to sidestep the high fee nickel and diming so common in the mutual fund and ETF industries.

    Whether you are looking for an equities fund, an income fund, a high yield bond fund or have an eye on retirement down the road, Vanguard has a variety of low expense ratio funds that have stood the test of time.

    So what are the best Vanguard funds?

    Total Stock Market Fund
    Best Vanguard Funds

    What is the simplest way to get started investing in the stock market?

    VANGUARD INVESTMENTS
    vanguard investments

    InvestorMint Rating

    4 out of 5 stars

    • Account Minimum: $0
    • Expense ratios: 0.18% (on average)
    • Commissions: As low as $2

    via Vanguard secure site

    The Vanguard Total Stock Market ETF [VTI] is about as good as it gets for any investor, especially beginners.

    When you factor in fees, few money managers will beat the Vanguard Total Stock Market fund over time – it’s that good!

    A combination of exceptionally low fees, low turnover and strong holdings makes it one of the best long term performers among the universe of ETFs.

    Minimum Investment Expense Ratio Risk
    $0 0.04% Above Average

    The portfolio composition is diversified across a range of equities sectors, including:

    • Basic Materials
    • Consumer Goods
    • Consumer Services
    • Financials
    • Healthcare
    • Industrials
    • Oil & Gas
    • Technology
    • Telecommunications
    • Utilities

    Financials and technology generally have a heavy weighting in the portfolio with stocks such as Facebook, Apple, Microsoft, Alphabet, and Amazon leading the technology group and J.P. Morgan and Wells Fargo featuring in the top 10 holdings list.

    The Vanguard Total Stock Market ETF gives you exposure to the best companies in the U.S. and has a strong track record of performance which is a primary reason it has accumulated over $500 billion in assets since inception.

    >> Check Out Our Vanguard Review

    Total Bond Market
    Best Vanguard Funds

    The Vanguard Total Bond Market ETF [BND] has an exceedingly low expense ratio compared to its peers; it’s just 0.05%.

    As an ETF, it is easy to buy and sell intraday – unlike mutual funds, which can only be transacted at the close of business – and it is a good way to diversify risks of holding equities in a portfolio.

    The Vanguard Total Bond Market ETF provides exposure to:

    • U.S. investment grade bonds
    • Investment grade bonds of credit quality Baa and above
    Minimum Investment Expense Ratio Risk
    $0 0.05% Average

    Since inception in 2007, the fund has generated annual returns just north of 4%.

    This bond fund has an average duration of just over 6 years, targets a yield of 3%, and is designed to produce reliable income streams over the medium to long term.

    >> Related: What Are Bonds?

    Real Estate Investment
    Trust Admiral Shares
    Best Vanguard Funds

    The Vanguard REIT Index Fund [VGSLX] is passively managed and tracks the performance of the MSCI US REIT Index.

    The goal of the fund is to provide a high level of income and moderate long-term capital appreciation.

    Minimum Investment Expense Ratio Risk
    $0 0.12% Above Average

    Since inception the Vanguard REIT Index has generated annualized returns just above 10% and has a dividend just shy of 4%.

    The fund has exposure to a broad range of REIT subsectors, including:

    • Retail REITs
    • Specialized REITs
    • Residential REITs
    • Office REITs
    • Healthcare REITs
    • Diversified REITs
    • Industrial REITs
    • Hotel and Resort REITs

    The Vanguard REIT Index holdings includes a who’s who of REIT companies, including Simon Property Group, Equinix, Public Storage, Boston Properties, and Digital Realty Trust among others.

    >> Prefer Hands-Off Investing? Check Out Vanguard’s Robo-Advisor

    Target Retirement 2050
    Best Vanguard Funds

    The Vanguard Target Retirement 2050 Fund Investor Shares [VFIFX] is a life-cycle fund meaning that as you approach retirement the allocation to equities diminishes and the allocation to bonds increases.

    The fund invests in four Vanguard index funds, and has a 90%/10% weighting of equities to bonds at this time.

    If you expect to retire around 2050, this fund allows you take a hands-off investing approach whereby your allocation to more conservative bonds will adjust automatically.

    Minimum Investment Expense Ratio Risk
    $1,000 0.16% Average

    The SEC yield on the fund is just above 2% at this time.

    >> Prefer Hands-Off Investing? Check Out The Best Robo Advisors

    Growth Index Fund Admiral Shares
    Best Vanguard Funds

    The Vanguard Growth Index Fund [VIGAX] invests in the stocks of large U.S. companies.

    Like so many other Vanguard funds, the expense ratio of 0.06% is very much lower than the amount charged by industry peers.

    The focus of the fund is on large capitalization stocks, so underperformance relative to the general market is always a risk.

    Minimum Investment Expense Ratio Risk
    $10,000 0.06% Above Average

    The fund has equity sector diversification to technology, healthcare, and consumer service predominantly, but also financials, consumer goods, oil & gas, basic materials and telecommunications.

    Among the top holdings in the fund are the best known names in U.S. industry, such as:

    • Apple
    • Alphabet
    • Amazon
    • Facebook
    • Comcast
    • Home Depot
    • Philip Morris International
    • Visa
    • Coca Cola
    • Walt Disney

    >> Related: What Are The Best Stocks To Buy?

    500 Index Fund Admiral Shares
    Best Vanguard Funds

    The Vanguard 500 Index Fund [VFIAX] is the first index fund for individual investors and was designed as an inexpensive way – the expense ratio is 96% lower than its peers at just 0.04% – to get diversified U.S. equity exposure.

    With full exposure to the stock market, the primary risk of the fund comes from general market volatility.

    Minimum Investment Expense Ratio Risk
    $10,000 0.04% Above Average

    Like other Vanguard funds, broad sector exposure is achieved with allocation to:

    • Information Technology
    • Energy
    • Financials
    • Healthcare
    • Industrials
    • Consumer Discretionary
    • Consumer Staples
    • Utilities
    • Telecommunications
    • Real Estate

    Some of the largest positions in the fund are Berkshire Hathaway, Facebook, Amazon, Alphabet, Apple, Johnson & Johnson, Microsoft, Wells Fargo and J.P. Morgan Chase & Co.

    >> Related: Is Twitter Stock A Buy Or A Sell?

    Equities Fund
    Best Vanguard Funds

    The Vanguard Windsor Fund [VWNDX] is a Large Value equities fund that scoops up value stocks with the potential to outperform the market, especially after recessionary periods.

    The composition of stock holdings is primarily in U.S. based equities but up to 30% of the funds assets can be invested internationally.

    Managers strive to find “value stocks that have strongly outperformed coming out of past bear markets, often for extended periods” by identifying companies that are out of favor and trading at price well below book value.

    Minimum Investment Expense Ratio Risk
    $3,000 0.30% High

    Financial, healthcare, industrial, energy and information technology are among the largest sector holdings in this fund of approximately 140 equities holdings.

    Since inception back in October 1958, the Windsor Fund has racked up an astonishing annualized return just north of 11% annually.

    Best Vanguard Funds Summary

    Depending on your age and time horizon to retirement, a heavier weighting towards bonds or equities will be more appropriate. Regardless of which fund you select from Vanguard, you can take comfort in knowing you are investing with a reputable company that has earned its stripes by honoring its commitment to charge low fees to customers while delivering over the long term on performance.

    VANGUARD INVESTMENTS
    vanguard investments

    InvestorMint Rating

    4 out of 5 stars

    • Account Minimum: $0
    • Expense ratios: 0.18% (on average)
    • Commissions: As low as $2

    via Vanguard secure site

    Have you invested in Vanguard funds? Did we miss any that you think should be included on the list? Share your comments below, we would love to hear from you.

    >> What Are The Best Index Funds?

    >> What Is The Fiduciary Rule?

    >> What You Need To Know Before Selling A Stock

  • What Is A Mutual Fund?

    What Is A Mutual Fund?

    inspiration

    InvestorMint provides personal finance tools and insights to better inform your financial decisions. Our research is comprehensive, independent and well researched so you can have greater confidence in your financial choices.

    Any financial advisor worth their salt will tell you that you need to build a diversified portfolio to spread your risk and to focus on the long term when building your retirement nest egg.

    But how do you construct a portfolio of stocks and bonds that meets your objectives, aligns with your risk tolerance, age, and time horizon?

    And how do you save yourself the time of researching stocks and bonds to add to your brokerage or retirement accounts?

    These are the problems that mutual funds solve. Mutual funds pool your funds and those of other investors to buy a collection of stock and bonds, and sometimes other assets.

    Mutual funds then charge you an ongoing fee for operating and managing the fund.

    As with many other investments, mutual fund returns are variable, so you risk losing money when things go awry with fund holdings.

    But the value of buying a mutual fund is that you are buying a diverse group of securities so the risk is not concentrated in any single position as it would be if you bought an individual stock or bond as opposed to a collection of stocks or bonds.

    Passive vs Active Mutual Funds

    When you invest in the stock market, you will discover two opposing investment philosophies.

    Those who believe they can beat the market fall into the active investor group. These investors believe that they can outperform the returns of benchmarks, such as the S&P 500. By pursuing the lofty endeavor of beating the market, these investors take on the risk of falling short of the mark, and underperforming a benchmark index.

    The opposing group of investors are those who believe it is not possible, or very difficult, to beat the market. These investors are content to simply track the returns of an individual benchmark. They don’t try to beat benchmark indices but equally they don’t underperform them.

    Mutual funds can be either passively managed or actively managed. Over a long time period, few investors consistently beat the market. For this reason, passively managed mutual funds and index funds have become ever more popular.

    Even when managers do beat the market for a sustained time period, mutual fund investors may not enjoy the spoils entirely because fees are withdrawn at the fund level to pay for fund management and ongoing operational and regulatory compliance costs.

    For these reasons, most robo advisors subscribe to Modern Portfolio Theory, which is an investment theory created by Dr. Harry Markowitz premised on the idea that risk-averse investors can build portfolios to maximize or optimize expected returns based on a given level of market risk.

    In a nutshell, this means that risk and reward are tied together. To achieve higher returns, you must take on more risk.

    A rare exception among robo advisors is Hedgeable, which seeks to better protect clients from stock market downturns and stock market crashes.

    >> Learn More About Robo Advisors

    How Much Does It Cost To
    Invest In A Mutual Fund?

    Fees are a big deal when choosing a mutual fund. Most investors are aware that a financial advisor charges a management fee, but few pay as much attention to the fees charged by mutual funds.

    These fees are easily overlooked because they are not charged directly to mutual fund holders, but instead they are charged at the fund level. So the mutual fund performance returns you enjoy are reported after fees have been withdrawn.

    But just because you don’t see the costs on your monthly statements doesn’t mean you shouldn’t have an eagle eye on how much you are being charged for investing in the mutual fund.

    When you combine the management fees of a financial advisor with mutual fund expense ratios, you may discover that you are paying more than you think.

    For example, if you compare two portfolios of $100,000, both of which are invested over a 30 year period earning returns of 8% annually, their values are starkly different at the end of the thirty year period depending on the levels of fees applied.

    Expense Ratio
    Year Annual Gain (8%) 0.50% 1.00% 1.50% 2.00%
    0 $100,000 $100,000 $100,000 $100,000 $100,000
    1 $108,000 $107,500 $107,000 $106,500 $106,000
    2 $116,640 $115,560 $114,485 $113,415 $112,350
    3 $125,971 $124,222 $122,488 $120,771 $119,070
    4 $136,049 $133,529 $131,045 $128,595 $126,180
    5 $146,933 $143,532 $140,193 $136,917 $133,702
    6 $158,687 $154,279 $149,974 $145,768 $141,660
    7 $171,382 $165,828 $160,429 $155,180 $150,078
    8 $185,093 $178,238 $171,605 $165,187 $158,980
    9 $199,900 $191,571 $183,551 $175,828 $168,395
    10 $215,892 $205,897 $196,319 $187,141 $178,350
    11 $233,164 $221,290 $209,965 $199,168 $188,875
    12 $251,817 $237,827 $224,550 $211,952 $200,002
    13 $271,962 $255,594 $240,136 $225,540 $211,763
    14 $293,719 $274,682 $256,790 $239,981 $224,193
    15 $317,217 $295,188 $274,587 $255,328 $237,329
    16 $342,594 $317,217 $293,602 $271,635 $251,209
    17 $370,002 $340,881 $313,918 $288,962 $265,873
    18 $399,602 $366,302 $335,622 $307,370 $281,363
    19 $431,570 $393,608 $358,809 $326,925 $297,725
    20 $466,096 $422,939 $383,578 $347,697 $315,004
    21 $503,383 $454,443 $410,035 $369,759 $333,251
    22 $543,654 $488,282 $438,293 $393,189 $352,516
    23 $587,146 $524,626 $468,474 $418,070 $372,853
    24 $634,118 $563,661 $500,705 $444,489 $394,320
    25 $684,848 $605,583 $535,125 $472,537 $416,976
    26 $739,635 $650,605 $571,879 $502,313 $440,883
    27 $798,806 $698,955 $611,124 $533,920 $466,108
    28 $862,711 $750,878 $653,024 $567,467 $492,718
    29 $931,727 $806,634 $697,757 $603,069 $520,786
    30 $1,006,266 $866,507 $745,511 $640,848 $550,388

    The investor paying just 0.5% in total fees annually turns $100,000 into $866,507 while the investor paying 2.0% in total fees annually sees their portfolio increase to $550,388.

    So, what seems like a small fee difference of “just” 1.5% each year ends up costing the second investor a whopping $316,000 in portfolio value over the thirty year period.

    >> More: What Are Bonds?

    What Types Of Mutual Funds
    Can You Invest In?

    Mutual funds fall into various categories of risk and return, including equity, bond, income, hybrid, and money market.

    EQUITY MUTUAL FUNDS

    Equity funds that comprise a diversified group of stocks are among the most popular mutual funds.

    Of all the mutual funds available to you, equity funds offer perhaps the greatest upside reward opportunity but also have commensurate levels of risk.

    One way to sidestep the expense ratios charged by mutual funds while still enjoying the benefits of diversification that they offer is via a company called Motif.

    Motif lets you buy a collection of stocks or ETFs inexpensively under a single umbrella via professional motifs or community motifs.

    Professional motifs are pre-built motifs that require no input from customers – much like a mutual fund.

    Community motifs are built by Motif customers, who bundle a customized selection of stocks or ETFs into a single motif, and can even get paid a small amount when other customers purchase those motifs.

    MOTIF SPOTLIGHT
    motif investing logo

    InvestorMint Rating

    4.5 out of 5 stars

    • Account Minimum: $0
    • Commissions: $4.95 per share
    • Commissions: $9.95 per motif
    • Automated portfolio management: $4.95 – $19.95 monthly

    BOND MUTUAL FUNDS

    Bond mutual funds tend to fall into one of three categories:

    1. Government bonds
    2. State and city bonds
    3. Corporate bonds

    The highest tier creditworthy bonds are government bonds but the yields paid to investors tend to be lower than those paid to municipal bond or corporate bond investors.

    Municipal bonds can be especially attractive when you buy bonds of the state you live in because the interest earned is often exempt from state taxes.

    Corporate bonds generally pay the highest yields but the risk of default is higher. Unlike government bonds that are backed by the full faith and credit of the U.S. government, corporate bonds are subject to greater risk.

    In rare cases, corporate bonds pay lower returns than some sovereign nations pay. For example, interest on bonds issued by Apple have paid lower yields than those paid by some countries because Apple has more cash on hand than many small nations.

    INCOME MUTUAL FUNDS

    As you transition from investing in the stock market in order to grow your nest egg to investing with a view to generating income as a retiree, consistent returns becomes ever more important.

    Typically, the biggest asset class change among investors takes place when aging from the 55-64 demographic to the 65-74 year old demographic when stock holdings diminish and bond holdings substantially increase.

    baby boomers bond with bonds

    Source: Haver Analytics, Gluskin Sheff

    Mutual funds holding high quality corporate debt, municipal bonds and government Treasurys tend to be most attractive for conservative investors.

    But just because government bonds or munis are generally believed to be safer doesn’t mean you should dive in without due diligence.

    For example, when a state has mismanaged its finances, such as Illinois experienced, the risk of default is higher than an investor might realize.

    HYBRID MUTUAL FUNDS

    Hybrid mutual funds comprise both stocks and bonds that offer a mix of both income and higher return potential (than bond funds alone).

    Many hybrid mutual funds purchase equity mutual funds and bond mutual funds, and are labeled as “fund of funds.”

    For investors who are closer to retirement and want to limit risk yet still want to capitalize on a rising stock market without owning a pure equity mutual fund, a hybrid fund can be an attractive compromise.

    MONEY MARKET MUTUAL FUNDS

    Generally, money market funds invest in short-term government debt and corporate debt so risk levels are very low.

    Money market mutual funds and bank savings accounts tend to rival each other when it comes to the interest paid.

    So, while you may not get rich depositing funds in a money market fund, the interest earned makes them a better place to store funds than a checking account for short time periods.

    For example, when you plan to buy a home and have a high level of cash on hand but cannot invest it for the long-term, a money market fund is often an ideal place to store your cash.

    INDEX FUNDS

    When your goal is to track a certain benchmark index, index funds made up of equities offer a way to match benchmark returns.

    Unlike equity mutual funds, which generally have the aim to beat their benchmarks, index funds are usually constructed to neither beat nor fall short of benchmark performances.

    For example, if you are looking to replicate the performance of the S&P 500, the Vanguard 500 Index Fund aims to match both price and yield performance.

    The index uses a market-cap weighting structure and invests in the 500 largest U.S. firms, such as Facebook, and charges an expense ratio of 0.18%.

    Symbol ETF Name Expense Ratio
    SPY SPDR S&P 500 ETF 0.09%
    IVV iShares Core S&P 500 ETF 0.04%
    VOO Vanguard S&P 500 ETF 0.04%

    EXCHANGE-TRADED FUNDS

    Exchange-traded funds, also known as ETFs, generally charge lower fees than mutual funds yet still offer the same diversification benefits.

    For example, the ETFs listed above, IVV and VOO, track the S&P 500 benchmark while charging extremely low expense ratios of just 0.04%.

    Why Invest In Mutual Funds

    DIVERSIFICATION

    Mutual funds provide you the opportunity to invest your savings in a diversified group of stocks or bonds without having to buy a large number of individual stocks or bonds.

    By diversifying your holdings, you lower your risk when compared to holding a small, concentrated group of stocks or bonds.

    COST SAVINGS

    By buying a mutual fund as opposed to a bunch of individual stocks or bonds, you also save on transaction costs when you buy and sell.

    By pooling your funds and those of others, mutual funds are a more cost effective way of building a diversified portfolio.

    >> Related: How To Diversify Your Portfolio Intelligently

    How You Make Money
    With Mutual Funds

    Mutual funds do not trade during the day like equities do. You cannot buy and sell intra-day as you can shares of a public company on the New York Stock Exchange.

    Mutual funds exchange hands after the market closes at their Net Asset Value. When the mutual fund NAV increases in value, you make money.

    You can also make money with mutual funds when the funds sell a holding that has increased in value.

    Plus, if companies that form part of the fund pay dividends, the mutual fund distributes a portion to mutual fund holders.

    What Are The Risks Of
    Buying Mutual Funds

    Beyond the costs of fees and expense ratios, a significant risk of buying mutual funds is year-end distributions.

    At the end of the year, you may be hit with a tax bill on capital gains distributions. Theoretically, you could buy a mutual fund in mid-December and be hit with a large tax bill the very next day.

    Sometimes, these distributions can be as large as 25% of the Net Asset Value of the fund, so the tax liabilities can be substantial.

    The way to sidestep the tax risk is to buy the mutual fund after the distribution has been made.

    Mutual fund companies generally publish the expected payouts, so you can avoid an unpleasant tax surprise by doing a little homework before you buy the fund.

    Actively managed funds generally have higher payouts than passively managed funds, and some funds have a history of large payouts so it is worth looking back in time before investing your money to examine the payout history.

    Another way to avoid the tax liability is to buy the mutual fund in retirement accounts, such as an IRA or 401(k), which enjoy tax-deferred growth of earnings until distributions are made.

    Have you found good mutual funds to invest in? Did you get surprised by a year-end mutual fund distribution? Share your comments below – we love to hear from you.

    >> What Are Bonds?

    >> How Much Does The Top 1% Make?

    >> Is Twitter Stock A Buy Or A Sell?

  • Fidelity vs. Vanguard: Lower Fees and Better Returns in 2026

    Fidelity vs. Vanguard: Lower Fees and Better Returns in 2026

    Fidelity vs. Vanguard for Low-Cost Investing: Which Brokerage’s Index Funds and ETFs Have Lower Fees and Better Returns in 2026?

    Fidelity and Vanguard both make it possible to build a diversified portfolio at extremely low cost. The practical difference is less about finding a universally superior investment return and more about choosing the funds, account features, and investing experience that fit your needs.

    Fidelity usually has the advantage for beginners, smaller accounts, fractional-share investors, and people who want extensive research and cash-management tools. Vanguard remains compelling for retirement investors who value straightforward buy-and-hold investing and its fund-shareholder-owned corporate structure.

    When two funds track the same benchmark, their returns should be nearly identical before expenses. Small differences can arise from expense ratios, portfolio sampling, trading, securities lending, cash holdings, and taxes. Those differences matter, but your asset allocation, contribution rate, and ability to stay invested will usually have a much larger effect on long-term results.

    Fidelity vs. Vanguard at a Glance

    Category Fidelity Vanguard
    Brokerage account minimum Generally $0 Generally $0
    Online U.S. stock and ETF commissions Generally $0 Generally $0
    Lowest proprietary index-fund expense ratio 0.00% through Fidelity ZERO mutual funds Approximately 0.03% for several broad-market ETFs
    Mutual fund minimums Many Fidelity index funds have no minimum Some Admiral Shares commonly require $3,000
    ETF availability Commission-free access to a broad ETF marketplace Commission-free access to a broad ETF marketplace
    Fractional investing Fractional trading across a broad selection of eligible stocks and ETFs More limited; fractional investing is principally available for eligible Vanguard ETFs
    Research and trading tools More extensive screening, research, and trading features Simpler experience focused on long-term investing
    Account service fees Most standard retail accounts have no recurring account fee A service fee can apply to certain accounts but may be waived, including through electronic delivery

    Commission-free does not mean completely cost-free. Options contracts, broker-assisted transactions, certain mutual funds, regulatory assessments, and other specialized services may carry charges. Always review the brokerage’s current pricing schedule.

    Who Fidelity or Vanguard Is Best For

    Fidelity may be better if you:

    • Are starting with a small balance and want mutual funds without investment minimums.
    • Want to invest a specific dollar amount in eligible stocks and ETFs using fractional shares.
    • Prefer detailed research, screening tools, planning calculators, and active-trading features.
    • Want brokerage, retirement, cash-management, credit card, and advisory services on one platform.
    • Are comfortable choosing among a large number of funds and account features.

    Vanguard may be better if you:

    • Want a simple portfolio built around broad-market index funds or ETFs.
    • Primarily invest for retirement and expect to hold positions for decades.
    • Value Vanguard’s structure, under which its U.S. funds own the management company and fund shareholders indirectly own those funds.
    • Prefer a platform whose design places less emphasis on frequent trading.
    • Already use Vanguard funds through an employer retirement plan.

    Both firms can serve long-term investors well. Neither is automatically best for every portfolio. An investor who needs sophisticated research may prefer Fidelity, while someone who wants only a three-fund retirement portfolio may find Vanguard entirely sufficient.

    Index Fund and ETF Expense Ratios Compared

    The following figures are commonly published expense ratios for representative funds. Fees, minimums, and share-class terms can change, so verify them on each provider’s 2026 fund page before investing.

    Market exposure Fidelity fund Expense ratio Vanguard fund Expense ratio
    S&P 500 Fidelity 500 Index Fund (FXAIX) 0.015% Vanguard 500 Index Fund Admiral Shares (VFIAX) 0.04%
    Total U.S. stock market Fidelity Total Market Index Fund (FSKAX) 0.015% Vanguard Total Stock Market ETF (VTI) 0.03%
    Total U.S. stock market Fidelity ZERO Total Market Index Fund (FZROX) 0.00% Vanguard Total Stock Market Index Fund Admiral Shares (VTSAX) Commonly 0.04%
    International stocks Fidelity Total International Index Fund (FTIHX) Commonly 0.06% Vanguard Total International Stock ETF (VXUS) Commonly around 0.05%
    U.S. investment-grade bonds Fidelity U.S. Bond Index Fund (FXNAX) Commonly 0.025% Vanguard Total Bond Market ETF (BND) Commonly 0.03%

    FXAIX and VFIAX both track the S&P 500, making them a relatively direct comparison. FSKAX and VTI provide similar total-market exposure, but they follow different indexes. Their holdings and performance therefore will not match perfectly.

    FZROX deserves special attention. Its 0.00% expense ratio eliminates the stated annual management expense, but FZROX is a mutual fund—not an ETF. It tracks a proprietary Fidelity index and generally cannot be transferred in kind to another brokerage. Moving an account may require selling it, which could create a taxable gain in a regular brokerage account.

    International-stock and bond funds require careful comparison because their benchmarks can differ substantially. A fund holding developed and emerging markets is not directly comparable with a developed-markets-only fund, even if both have “international index” in their names.

    How Much Do Small Fee Differences Affect Returns?

    Assume $100,000 is invested for 30 years, the portfolio earns 7% annually before fund expenses, and there are no contributions, withdrawals, or taxes. The estimates below subtract each expense ratio from the assumed gross return and compound annually.

    Expense ratio First-year expense on $100,000 Estimated value after 30 years Estimated drag versus 0% fee
    0.015% $15 Approximately $758,000 Approximately $3,200
    0.03% $30 Approximately $754,800 Approximately $6,400
    0.04% $40 Approximately $752,700 Approximately $8,500
    0.40% $400 Approximately $680,300 Approximately $80,900

    The difference between 0.015% and 0.04% is real, but modest: approximately $25 during the first year on a $100,000 balance. By comparison, moving from a 0.04% index fund to a 0.40% fund creates a much larger long-term cost.

    A lower expense ratio creates a predictable cost advantage; it does not guarantee the higher total return. Two funds may follow different indexes, hold different securities, or realize different trading and tax costs.

    Expense ratios also exclude bid-ask spreads, premiums or discounts to ETF net asset value, taxes, advisory charges, and the opportunity cost of uninvested cash. The yield paid on a brokerage’s cash sweep can be more financially significant than a 0.01-percentage-point difference between index funds.

    Historical Returns: Fidelity vs. Vanguard Funds

    There is no single “Fidelity return” or “Vanguard return.” Performance belongs to the individual fund and its underlying portfolio. A valid comparison must match funds by asset class and, ideally, by benchmark.

    Comparison Relevant benchmark or exposure Expected interpretation
    FXAIX versus VFIAX S&P 500 Index The closest head-to-head comparison; differences should normally be small.
    FSKAX versus VTI or VTSAX Total U.S. stock market Similar exposure, but different underlying indexes can produce modest differences.
    FTIHX versus VXUS or VTIAX Total international market Compare country coverage, small-cap exposure, and benchmark construction.
    FXNAX versus BND or VBTLX Broad U.S. investment-grade bonds Review duration, mortgage exposure, credit quality, and benchmark methodology.

    For a time-sensitive 2026 comparison, retrieve standardized average annual returns from each fund’s official page for the same month-end date. Record the 1-year, 5-year, 10-year, and since-inception returns, along with the benchmark return. Do not combine a June 30 return from one provider with an August 31 return from another.

    This article does not insert unverified 2026 performance figures because those numbers update monthly or quarterly. Current results can be checked on Fidelity’s FXAIX fund page and Vanguard’s VFIAX fund page. Use the latest common reporting date displayed by both providers.

    Matching index funds should remain close over long periods. The fund with the lower expense ratio may have a slight advantage, but tracking difference, securities-lending revenue, sampling, and portfolio turnover can offset or reverse a small fee gap during a particular period.

    A one-year winner should not be treated as the permanent better fund. Reported performance describes a historical period; it is not a forward-looking return forecast, and past performance does not guarantee future results.

    Account Minimums, Features, and Usability

    Both firms generally allow investors to open a standard brokerage account without a minimum deposit. Fund-level requirements are separate. Many Fidelity retail index mutual funds have no investment minimum, while certain Vanguard mutual fund share classes commonly require $3,000. Vanguard ETFs can generally be accessed with substantially less money when fractional purchases are available.

    Where Fidelity stands out

    • Broad fractional-share access for eligible stocks and ETFs.
    • Detailed investment research, screeners, charting, and planning tools.
    • Cash-management features, including bill payment and debit-card access in eligible accounts.
    • A broad selection of mutual funds, ETFs, bonds, managed accounts, and trading services.
    • Automatic investing that can accommodate many small, recurring contributions.

    Where Vanguard stands out

    • A straightforward selection of established broad-market index funds and ETFs.
    • Retirement planning, target-date funds, and long-term investing education.
    • An investor-owned structure that is unusual among major asset managers.
    • A simpler interface that some investors may find less tempting for frequent trading.
    • Digital advice and human-advice options for investors who want portfolio management.

    Both firms offer mobile applications, automated investing, target-date funds, robo-advisory services, and access to human guidance. Prices and eligibility requirements differ, so compare advisory fees separately from fund expense ratios.

    Risks, Pros and Cons, and Alternatives

    Fidelity pros

    • Extremely low-cost index funds, including proprietary 0.00% expense-ratio funds.
    • Many mutual funds with no investment minimum.
    • Flexible fractional-share investing.
    • Strong research, cash management, and account features.

    Fidelity cons

    • Fidelity ZERO funds are proprietary mutual funds and are generally not transferable in kind.
    • The number of products and tools may feel complicated to a new investor.
    • Easy access to trading features can encourage unnecessary activity.

    Vanguard pros

    • Broad, low-cost index funds with long operating histories.
    • A distinctive fund-shareholder-owned structure.
    • Strong retirement orientation and target-date fund lineup.
    • Simple building blocks for two-, three-, or four-fund portfolios.

    Vanguard cons

    • Fractional trading is less flexible than Fidelity’s broader program.
    • Some investors find its website and trading experience less polished.
    • Certain mutual fund share classes have minimum investments.
    • An account service fee may apply when waiver conditions are not met.

    Investors at either brokerage face the same fundamental risks. Stock funds can lose substantial value during bear markets. S&P 500 funds are concentrated in large U.S. companies, while total-market funds can still be heavily influenced by the largest stocks. International funds add currency and geopolitical risk. Bond funds can decline when interest rates rise or credit conditions deteriorate.

    Charles Schwab is a reasonable alternative for investors who want low-cost index funds, strong service, and a broad banking and brokerage platform. Another option is to buy a portable portfolio of low-cost ETFs from Vanguard, iShares, Schwab, or another provider through whichever brokerage offers the preferred account features. You do not have to use Vanguard as your broker to own VTI or another Vanguard ETF.

    Bottom Line: Which Brokerage Should You Choose in 2026?

    Choose Fidelity when no-minimum mutual funds, broad fractional-share trading, cash management, research, and platform flexibility are priorities. Its low-cost index lineup is highly competitive, and its broader financial ecosystem can be convenient for investors managing several account types.

    Choose Vanguard when you want a simple, low-cost retirement portfolio and value a platform built around disciplined, long-term investing. Vanguard’s flagship ETFs remain practical portfolio building blocks even when purchased through another brokerage.

    Neither company has a permanent performance advantage. If you buy the same ETF at Fidelity and Vanguard, the investment’s underlying return will be the same. Only account-level details such as execution price, fractional-share handling, cash management, and any applicable fees may differ.

    What to do next

    1. Define your target allocation among U.S. stocks, international stocks, bonds, and cash.
    2. Compare funds with equivalent benchmarks rather than relying on similar names.
    3. Verify current expense ratios, minimums, transfer rules, and standardized performance on official 2026 fund pages.
    4. Automate contributions and dividend reinvestment when appropriate.
    5. Review the portfolio annually instead of reacting to short-term performance.

    This article is for general educational purposes and does not provide personalized investment, tax, or legal advice. Investment returns are not guaranteed, and diversified funds can lose value.