

When you first arrive at Finviz, a jumble of stock symbols, charts, and prices hit you. But hang tight if it seems intimidating because you may soon feel a giddy excitement at the prospect of exploring this extraordinary financial tool suite.
If you are an active trader searching for a powerful stock screener, Finviz is hard to beat.
Finviz, which is short for Financial Visualizations, is a one-stop shop for equities, futures, and forex traders who want to find new trading opportunities and backtest strategies.
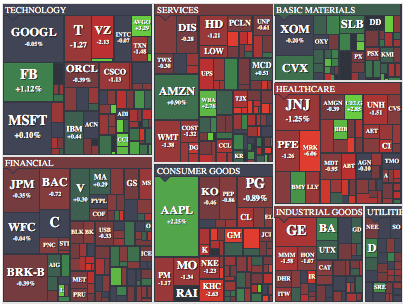
Intuitive heatmaps can be used to spot which stocks are in the red and black each day. Plus, a wealth of financial information lies under the hood from insider trading to earnings releases.
Charts are easily customized to your own setting preferences and you can save your portfolio of stocks to watchlists for easy review and tracking.
Free users get access to quotes, charts, and screening at no cost but if you would like access to real-time data, intra-day charts, alerts, fundamental charts, backtesting, and remove ad interruptions, you will need to pay the monthly price of $39.50 or the annual price of $299.50.
If that seems like a good deal, you are not alone in thinking so. As many as 15 million people visit Finviz monthly, and after a few minutes checking it out as you will see in this Finviz review, the attraction is obvious.
Finviz Spotlight
| FINVIZ SPOTLIGHT | |
|
InvestorMint Rating 4.5 out of 5 stars |
via Finviz secure site |
How To Get Started At Finviz
Your first experience at Finviz may be overwhelming with so much data to interpret but it only takes a few moments to find stocks paying high dividend yields that are rated a Strong Buy . Plus, literally tens of thousands of other custom screens can be entered.
If there were one major knock against Finviz, it would be the user experience for newbies to the site.
Once you’ve explored the site, you can quickly navigate to where you want to go, but the first impression is intimidating to say the least.
And Finviz doesn’t do a particularly good job simplifying the process. For example, the “First Time Here? Watch the Guided Tour” video is almost entirely hidden at the bottom of the home page, squeezed between oodles of financial data. You need to skip past a few hundred stock symbols and not be tempted to click any of them to find the video!
If you take a deep breath and quash the feelings of being overwhelmed for a couple of minutes, you will be in for a treat when it comes to functionality and screening capabilities, which are the flagship service offerings.
STEP 1
We recommend watching the introductory video as the first step. It is a good guided overview of the primary site features.
If you are an active trader, a tingling sense of excitement should be rising after you view it as you get your first insights into just how powerful the Finviz software really is.
STEP 2
Enter a stock symbol in the top left search field on the home page to bring up your favorite stock, such as Facebook or Netflix.
A customizable chart pops up that you can easily modify it to view in candlestick, line or advanced format.
With millions of visitors landing on Finviz each month, it’s no surprise that ads feature prominently but if you can resist the temptation to click on them for a few moments, you can view key financial metrics, analyst ratings, latest news releases about the company, and transactions made by insiders.
Plus, a StockTwits feed features on the lower right rail so you can view recent community comments about the stock.
STEP 3
Across the top navigation bar you will find a host of buttons including maps, which relate to visual heatmaps that show you which stocks, futures and forex are popping or dropping. We recommend you skip past these momentarily, and check out the Screener, which is the foundation of the Finviz service.
Be warned that you might have another “Oh My God” reaction when you land on the Screener page. It is jam-packed with information that will exhilarate technical traders and active traders looking to scan for specific criteria.
The best way to get comfortable with the Screener is to dive right in. Don’t worry about the numerous dropdown menus that you can customize later but rather play around with some selection options, such as Dividend Yield and Analyst Recommendations.
If they were the only two options you selected, you could in a heartbeat find dividend paying stocks with a minimum yield of say 4% that are rated a Strong Buy by analysts.
At this point, you will probably have been interrupted by ads a few times. They can be a pesky nuisance, but it’s the price paid for getting free access to this powerful stock screener. To shut off the ads permanently, you will need to sign up to the paid plan, called Elite Finviz.
Finviz Stock Screener: How It Works
The Finviz screener helps you to sort stocks by market cap, volume, sector, price, analyst rating, fundamentally, technically, and a host of other criteria.
The capabilities of the Finviz screener are limited mostly by your own imagination. Just about every combination of financial metric you could conceive of can easily be specified and screened.
MARKET CAP STOCK SCREENER
If you are a penny stock fan, you can screen for companies with micro (under $300 million) and even nano (under $50 million) market capitalizations.
Or if you are an institutional investor looking for big behemoth companies with market caps north of $200 billion, they can be sorted easily too.
AVG DAILY VOLUME SCREEN
Liquidity is an issue with smaller market capitalization companies, and you can filter by volume to avoid these. Average daily volume filters range from under 50,000 shares per day to over 10 million shares daily.
SECTOR & INDUSTRY SCREENS
Investors naturally are attracted to popular sectors and industries or those they know well. For example, if you spent your professional career working at Pfizer, screening for stocks in the healthcare sector may be your best bet starting out.
ANALYST RATING SCREENER
Wall Street analysts spend weeks crunching numbers of financial statements from publicly traded companies. You can leave that hard work to them and save yourself the time of breaking out a spreadsheet and performing a DCF (discounted cash flow forecast) model. In order to identify whether a stock is fundamentally overvalued or undervalued, select the Analyst Rating screener and you can spot in the blink of an eye which stocks are rated Buy and Sell by analysts.
PRICE SCREENER
Another popular screen is the Price screen. If you have a small amount of money in your brokerage account at say thinkorswim or tastyworks, you probably won’t be buying much Alphabet stock anytime soon, and it’s a good idea to filter out other high-priced stocks.
However, if you are a registered investment advisor looking to invest a lot of capital on behalf of clients in a short time period, you probably want to avoid even the best penny stocks and look to the industry bellwethers regardless of price.
OPTIONABLE STOCKS SCREEN
Over the last few decades, options trading has become increasingly popular as traders embrace the merits of covered calls strategies to generate regular income and married puts to hedge against downturns, as well as dozens of other options trading strategies.
The Finviz Option Screen lets stock and options traders find companies that have options chains and exclude those that don’t cater to options.
FLOAT SHORT SCREEN
When stocks are heavily shorted, any pop higher in price can lead to a virtual feeding frenzy among short stock traders needing to buy-to-cover their positions, which in turn can lead to even higher prices in heavily shorted stocks.
Traders who like to exploit these types of short interest positions or those with virtually no short interest whatsoever can do so with a few simple clicks.
FUNDAMENTAL STOCK SCREENER
If you are a fundamental investor, the Finviz screener may knock your socks off. If you can think of a financial metric you want to screen for, it will almost certainly be available.
A sampling of fundamental metrics you can screen for include:
- Price/earnings ratio
- Gross margin
- Operating margin
- PEG ratio
- Institutional ownership
- Price/sales ratio
- Price/book ratio
- Debt/equity levels
- Return on equity
- Return on assets
- Quick ratio
- Sales growth
CHART SCREENER
The Chart Screener is equally impressive. Technical chart traders can filter across a wide variety of technical chart studies and other chart criteria to find stocks that meet their needs.
A sampling of the chart criteria you can screen for includes:
- Patterns
- Wedge
- Triangle
- Head & shoulders
- Inverse head & shoulders
- Descending triangle
- Ascending triangle
- Channel
- Support
- Resistance
- RSI
- 20-day moving average
- 200-day moving average
- Average true range
- Beta
- Volatility
➤ Free Guide: 5 Ways To Automate Your Retirement
Finviz Review: Futures & Forex
If equities and options aren’t your thing but futures or forex are then you can view quotes, charts and performance in an instant on Finviz.
Perhaps one of the most impressive aspects of the Finviz web-based software is how fast it is to load charts and data – it is lightning fast.
FUTURES
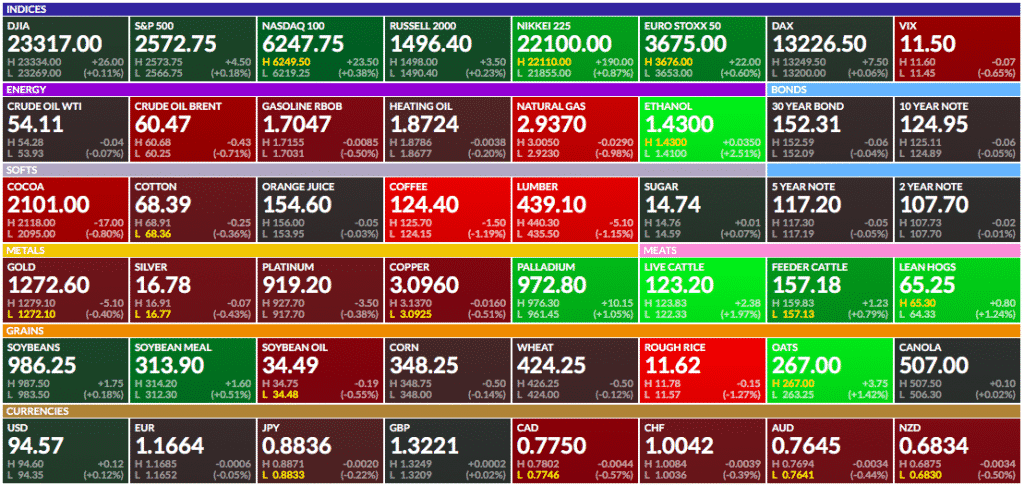
Futures data is presented in visually intuitive heatmaps that let you quickly see which areas of the market are performing well or poorly over different time periods.
Everything from metals to coffee and from soybeans to natural gas is presented for easy viewing.
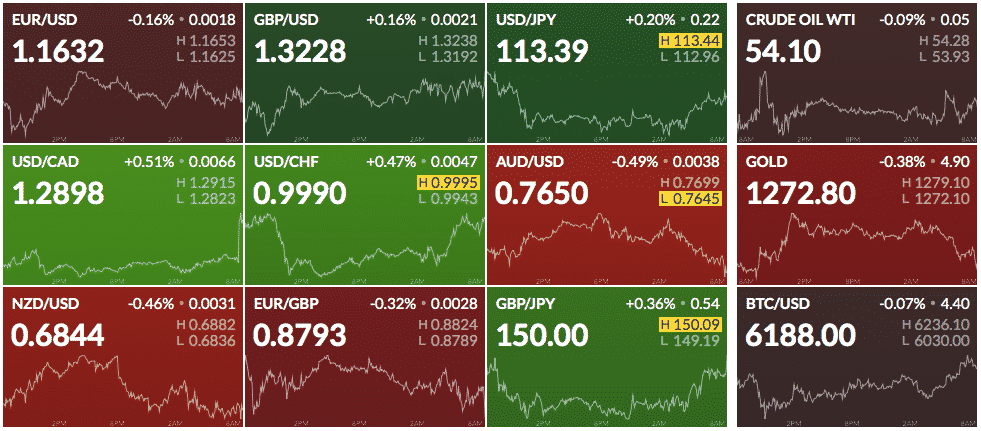
FOREX
All the major currency pairs are presented with a slight delay to users who are free members or have not registered but paid members get real time data to view pairs, such as:
- EUR/USD
- USD/JPY
- AUD/USD
- USD/CHF
- USD/CAD
- GBP/USD
Finviz Review: Pros and Cons
Finviz charges low monthly and annual prices for access to extensive stock screening functionality as well as to watchlists, futures and forex heatmaps, and a large variety of customizable filters to support fundamental investors and technical traders.
| Finviz Pros | Finviz Cons |
| ✅ Extensive Stock Screening: Finviz has world class stock screening tools to cater to fundamental investors, chart technicians, options traders, futures, and forex traders. | ❌ Overwhelming For Newbies: The first experience at Finviz is intimidating because so much data is presented on a single screen making it difficult to know where to begin. |
| ✅ Low Price: The monthly price of $39.50 is a good deal considering all that Finviz offers and the annual pricing of $299.50 is a bargain relative to the value provided. | ❌ User Experience: If you know what you want to screen for you can find it easily but if you are puzzling through your first screens, the user experience won’t provide you much instruction to figure out where to begin. |
| ✅ Backtesting: If you want to simulate how a trading strategy would have performed historically you can do so easily. | |
| ✅ Save Watchlists: To save watchlists and screens, you will need to register as a Finviz member or pay for premium access via Elite Finviz. | |
| ✅ Real Time Data: Paying members get access to real-time quotes, charts, and screens. Free and registered users will experience a delay when viewing data of 3-5 minutes. | |
| ✅ Futures & Forex Heatmaps: All major currency pairs as well as all common futures are featured in easy-to-read heatmaps so that winners and losers can be spotted easily. |
Finviz Pricing
| Feature | Free | Registered | Elite Paid |
| Quotes, Charts, Screening | Delayed | Delayed | Realtime |
| Maps, Groups | 3-5 minutes | 3-5 minutes | Realtime |
| Intraday Charts | ❌ | ❌ | ✅ |
| Advanced Charts/ Technical Studies | ❌ | ❌ | ✅ |
| Technical Studies Backtest | ❌ | ❌ | ✅ |
| Fundamental Charts | ❌ | ❌ | EPS, Sales, Shares |
| Email Alerts | ❌ | ❌ | Price, Insider, Rating, News |
| Correlations | ❌ | ❌ | ✅ |
| Officers | ❌ | ❌ | ✅ |
| Portfolios per User | ❌ | Max 50 | Max 100 |
| Tickers per Portfolio | ❌ | Max 50 | Max 100 |
| Screener Presets | ❌ | Max 50 | Max 100 |
| Screener Rows per Page (table, charts, snapshots) | 20/36/10 | 20/36/10 | 100/120/150 |
| Screener Export | ❌ | ❌ | ✅ |
| Screener Custom Range, Stats View | ❌ | ❌ | ✅ |
| Layout Customization | ❌ | Layout signals | |
| No Ads | ❌ | ❌ | ✅ |
Finviz Review Summary
Finviz is a stock screening tool suite that stands head and shoulders above most others. It is so popular among retail and institutional traders that it attracts millions of visitors each and every month.
Beyond the extensive screening capabilities, intuitive heatmaps, forex and futures support, and customization of layout, charts, and screens, Finviz provides access to transactions made by insiders, a social community via StockTwits, and the latest news for each stock.
When you compare the functionality provided to the price charged, the value is compelling. And Finviz would probably earn a full 5-star review if it were not for the intimidating interface that new users experience in getting familiar with the web-based software.
The bottom line is if you want access to top notch stock screening tools, you will search a long time before finding anything that rivals let alone beats Finviz, especially at the low prices charged.