Live a richer life. Independent financial guidance for smarter decisions.

Advertiser Disclosure

Search results for: “index fund”

  • Charles Schwab Review 2020

    Charles Schwab Review 2020

    schwab review

    charles schwab brokerage trading platform

    InvestorMint provides personal finance tools and insights to better inform your financial decisions. Our research is comprehensive, independent and well researched so you can have greater confidence in your financial choices.

    Schwab is a full-service brokerage firm that will impress new clients with high touch points, such as quick phone calls post sign-up, responsive live chat features, perhaps the best research in the industry, including proprietary stock ratings, intuitive trading platforms, streaming live events via Schwab Live, and competitive commissions’ costs.

    Options traders will love Schwab’s options platform that was built with the proficient options trader in mind, and features such as the all-in-one ticket trade feature. Plus on-the-go traders will find Schwab’s mobile solutions, whether Smartphones, Tablets or Watches to be a pleasant user experience.

    Charles Schwab Spotlight

    CHARLES SCHWAB SPOTLIGHT
    charles schwab

    InvestorMint Rating

    4.5 out of 5 stars

      • Promo: Get up to $500 cash with a deposit of $100,000+
      • Account Minimum: $1,000
      • Commissions: $4.95

    Charles Schwab Customers

    Charles Schwab pioneered low-cost trading that made it possible for the masses to access markets inexpensively, and the strategy of low-cost commissions combined with best-in-class customer service has resulted in Schwab managing well over $2 trillion in client assets.

    Charles Schwab serves beginner traders and active, experienced traders equally well. Schwab’s platforms include:

    • StreetSmart.com, which is web-based and best for beginners;
    • StreetSmart Edge, which is desktop-based; and
    • Trade Source, a website.

    Schwab’s options platform is designed for experienced options traders and includes advanced capabilities, such as Walk Limit that optimizes for the best National Best Bid or Offer (NBBO) price.

    A wide variety of tradeable securities are supported to meet the needs of almost any trader across the spectrum:

    • Stocks
    • Options
    • Bonds
    • Mutual funds
    • Futures
    • Pink Sheets (OTCBB)
    • ETFs

    For investors seeking life planning and retirement preparation advice, Schwab also has extensive support and resource capabilities. As a result, Schwab caters to not only the self-directed trader but the hands-off investor too.

    Charles Schwab is an excellent fit for the following trader types:

    • Beginner traders
    • Hands-off investors
    • Options traders
    • Experienced traders
    • Retirees
    • Traders in need of quality research
    • Mutual fund and ETF investors

    Charles Schwab Promo Deal

    Charles Schwab offers tiered cash rewards as high as $500 for deposits.

    • Earn a cash bonus of $100 with a deposit between $10,000-$24,999
    • Earn a cash bonus of $200 with a deposit between $25,000-$49,999
    • Earn a cash bonus of $300 with a deposit between $50,000-$99,999
    • Earn a cash bonus of $500 with a deposit of $100,000+

    Charles Schwab Pros and Cons

    Charles Schwab has an abundance of positive attributes going for it, including high quality research, excellent customer support, low commissions for the most part, mobile trading, and intuitive trading platforms.

    Charles Schwab Pros Charles Schwab Cons
    Industry-Leading Research: Schwab is known for its industry-leading research that stands head and shoulders above most of its competition, with Fidelity as the lone standout exception.
    Unlike many competitors who leverage third party research alone, Schwab has its own proprietary equity rating system and an extensive staff of research experts along with third party research from Morningstar, S&P Capital IQ, Market Edge and others.
    Mutual Funds Costs: Despite competitive equity commissions costs, Schwab ranks among the most expensive platforms when it comes to mutual fund costs, pricing transactions at $76 per trade.
    Schwab Intelligent Portfolios: Charles Schwab’s history of pioneering innovation continued with its launch of Schwab Intelligent Portfolios, a robo-advisor service, which charges no annual management fees nor account service fees. Real-time Manual Refresh: Mobile apps require manual refresh of real-time data. Watchlists do auto-refresh at 10 second intervals, but this somewhat defeats the purpose of real-time data.
    ✅ Options Platform: Schwab’s acquisition of OptionsXpress extended its options capabilities to support experienced, active options and futures traders and features:

    • Virtual Trading
    • Advanced order entry
    • Options analysis of Greeks, risk and reward and more
    • Powerful screeners
    • Execution of virtually any options trading strategy via XSpreads
    Extensive List of Tradeable Securities: Charles Schwab supports an extensive list of tradeable securities:

    • Stocks
    • Options
    • Bonds
    • Mutual Funds
    • ETFs
    • Futures
    • Pink Sheets
    ✅ Commissions: At just $4.95 per stock trade and $4.95 + $0.65 per contract for options trades, Schwab ranks among the lowest cost online brokers.
    Schwab also has low expense ratios for index funds and ETFs.
    Sales charges on mutual funds that carry loads are waived.
    Schwab also has a wide breadth of 200+ commission-free ETFs.
    Easy-to-Use, Powerful Trading Platform: Schwab offers numerous trading platforms:

    • TradeSource (website)
    • StreetSmart Edge (desktop)
    • StreetSmart.com (web)

    StreetSmart.com is a good platform for beginner traders though is not as up-to-date as other platforms; it’s based on Java which is not supported by Google Chrome or Microsoft Edge browsers.
    TradeSource will attract experienced traders more so than StreetSmart.com. TradeSource has intuitive order forms for stocks, ETFs, and options and provides full access to research, technical analysis and portfolio management.
    StreetSmart Edge targets more advanced traders with screeners, tools and a customizable interface, but is not as intuitive to use as other platforms.
    Schwab’s ETF Portfolio Builder tool allows investors create diversified portfolios based on risk tolerance.

    ✅Mobile Trading: On-the-go trading is possible via Smartphone (Apple & Android), Tablet (Apple only) and Watch (Apple only).
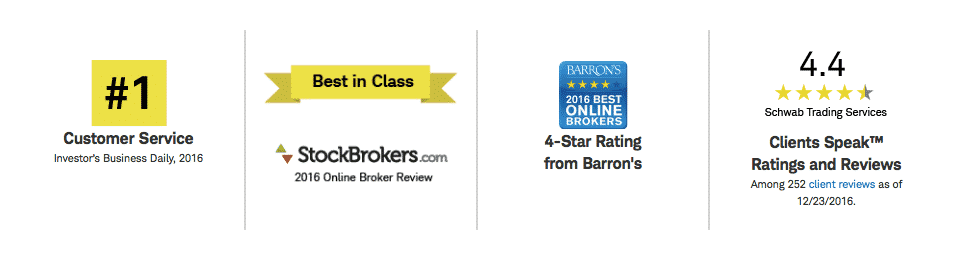
    ✅Customer Service: Schwab ranks among the best in the industry for its customer support with high touch points, fast responsiveness and accessibility via phone 24/7 as well as Live Chat, Email and local branch support.

    Charles Schwab Securities

    Other than Forex, virtually every other tradeable security is available through Schwab’s options platform:

    • Stocks
    • Options
    • Bonds
    • Mutual funds
    • Futures
    • Pink Sheets (OTCBB)
    • ETFs

    Charles Schwab Fees

    Charles Schwab has an industry-leading fee schedule, particularly as it relates to options and stocks:

    Security Fees
    Stocks $4.95 flat fee
    Options $4.95 + $0.65 per contract
    Mutual Funds $76 per trade
    Margin rate range 6.25% – 8.50%
    Broker-assisted trades $25 additional fee
    Account Balance Minimum $1,000
    Fees Inactivity Fees: $0
    IRA Closure Fee: $50

    Charles Schwab Platform Features

    Type Capability
    Desktop YES (SmartStreet Edge)
    Web-based YES (StreetSmart.com)
    Mobile YES (Apple and Android smartphones; only Apple tablets and Watch)
    Virtual Trading NO
    Screeners YES
    (Stocks, ETF, Bonds, Mutual Funds, Options)
    Customer support Phone Support 24/7
    Email Support
    Live Chat Support
    Real-time quotes YES
    Research YES
    (proprietary equity ratings, Morningstar, S&P Capital IQ, Market Edge, and more)
    Chart Tools YES
    (> 30 indicators)
    Commission-free ETFs YES
    (largest industry selection)
    No-transaction-fee Mutual Funds YES
    (OneSource Funds)

    Charles Schwab Summary

    Schwab is a compelling choice as a one-stop solution for beginner traders, active traders, options traders, hands-off investors and just about every trader type in between.

    Featuring 24/7 phone support, Live Chat, Email and local branch accessibility its customer support ranks among the best in the business. Schwab stands toe-to-toe with competitors like Fidelity and ETrade on commissions costs, high quality research, an extensive range of commission-free ETFs and powerful trading platforms.

  • Best IRA Providers 2020

    Best IRA Providers 2020

    InvestorMint provides personal finance tools and insights to better inform your financial decisions. Our research is comprehensive, independent and well researched so you can have greater confidence in your financial choices.
    Fees. Fees. Fees. Imagine you have $1,000,000 saved up at retirement. Each year, you withdraw $50,000 and your IRA account provider charges an annual 2% fee. That 2% fee doesn’t sound like a lot but it results in $20,000 in year one, representing 40% of what you put in your own pocket. You worked hard to save your nest-egg, so be careful not to let fees eat it up – over time, seemingly small fees can add up to large amounts and be deceptively corrosive to portfolio value.

    Beyond fee considerations, customer support is perhaps the next most important consideration when selecting a retirement account provider. Robo-advisors have low fees but not all have the support network of financial advisors that higher fee, traditional brokers provide. Investment selection and account minimums are important factors to weigh too before making a decision on who to choose for your IRA account.

    Best Robo-Advisors For IRAs

    Which Robo-Advisors are best for IRA account management?

    The trend towards lower fee, robo-advisory services is the future with the Millenial generation flocking to them in favor of traditional financial advisors, who will increasingly be replaced by these lower fee alternatives capable of providing comparable, if not superior, money management services.

    Betterment, Wealthfront, Future Advisor and Personal Capital stand out as leading robo advisors. Large, established brokers like Fidelity have launched their own robo advisors (Fidelity Go) respectively.

    Personal Capital has an attractive combination of low fees, accessible financial advisors, and supports traditional IRA accounts, Roth IRAs, SEP IRAs, as well as featuring among the best rollover IRA account providers.

    The management fee charged by Personal Capital ranges from 0.49%-0.89%. Personal Capital also stands out from its peers with an excellent mobile app that allows you easily track your day-to-day spending, cash flow, portfolio holdings, and net worth.

    Betterment has no minimum balance requirement and that enticement has attracted over 150,000 customers and $6.1 billion in assets under management. Betterment automatically rebalances portfolios using exchange-traded funds and caters to traditional IRAs, SEP IRAs, Roth IRAs and Rollovers IRAs.

    Like many other robo-advisors, Betterment applies modern portfolio theory to assets: cash is automatically invested in a diversified portfolio and portfolios are rebalanced automatically each time an asset class moves more than 3% from its target percentage level.

    betterment
    personal capital logo

    Best All-Round IRA Providers

    Low fees are important but investors with complex financial circumstances may need additional customer support, and broader investment selections. If you are looking for the best IRA companies, the providers below have the best all-round service.

    Retirement planning is personal and having an expert hold your hand through the process can offer a lot of value. Being able to walk into a local office to meet your financial advisor in person is comforting, particularly when markets fall. For this reason, Charles Schwab and Scottrade stand head and shoulders among their peers.

    Schwab offers customer service 7 days a week and 24 hours per day. Both have local branch offices where you can meet and visit with your dedicated financial advisor. And both offer extensive retirement planning tools. Plus, both have very broad investment selections, the value of which should not be underestimated.

    charles schwab
    scottrade logo
    • Standout Feature
      Scottrade ELITE desktop-based platform
    • Commissions
      Stocks: $6.95 per trade; Options: $6.95 + $0.70 per contract
    • Account Minimum
      $2,500 for brokerage; $0 for IRAs

    Best IRA Companies For Traders

    Renowned billionaire investor, Warren Buffett, counsels that for most investors a diversified portfolio is the smartest choice. But for the handful of investors who can “buy the fear, and sell the greed” as Buffett says, as part of an active trading strategy, the following brokers offer excellent platforms.

    TastyWorks offers one of the most competitive trading platforms when comparing transaction prices. Stock opening trades are just $5.00 irrespective of the number of shares traded. For options and futures traders, pricing is highly competitive when compared to industry peers, just $1.00 per contract for opening options trades, and $2.50 per contract for opening futures trades. TastyWorks supports Traditional IRA accounts and features among the best Roth IRA account providers too.

    TradeKing offers a highly attractive $4.95 stock trade commission charge and an extensive range of tools on its trading platform. A minimum account balance of $2,500 is required at TradeKing and an annual $50 fee is charged for inactive accounts or those falling below the account minimum threshold level.

    tastytrade (previously known as tastyworks)
    • Standout Feature
      Closing trades for Stocks & ETFs and Options are commission-free
    • Commissions
      $0 flat rate for stocks
    • Account Balance Minimum
      $0
    tradeking
    • Promo
      Get up to $1,000 in commission-free trades
    • Commissions
      Stock trade commissions: $4.95 flat rate; Options trade commissions: $4.95 + $0.65 per contract
    • Account Minimum
      $0

    Best Low Cost IRA Providers

    Low expense ratios and a large selection of funds are offered by these IRA providers.

    Vanguard established its reputation as the leading low-cost provider when it pioneered index fund investing and its 0.30% flat management fee for Vanguard Personal Advisor Services continues the low cost trend. While Vanguard continues to lead its industry peers on fee comparisons though it does fall short of Fidelity in its selection range of commission-fee ETFs and no-transaction-fee mutual funds.

    Fidelity Go is the robo-advisor offering by Fidelity, charging 0.35%, including investment expenses – a pioneering fee schedule among robo advisors – on retirement assets. Fidelity has a broader range of mutual funds than Vanguard but many have a minimum investment criterion of $2,500. Investment minimums are waived with monthly auto-deposits of at least $200.

    fidelity go
    vanguard investments
  • Best Online Stock Brokers For New Traders 2020

    Best Online Stock Brokers For New Traders 2020

    InvestorMint provides personal finance tools and insights to better inform your financial decisions. Our research is comprehensive, independent and well researched so you can have greater confidence in your financial choices.

    As a new trader or investor, low transaction costs and fast execution speeds are two of the most important criteria to screen for when evaluating online stock brokers. A strong emphasis on customer support, an intuitive easy-to-use platform and extensive educational resources are especially valuable.

    Overall Best Online Stock Brokers For New Traders

    Stocks Brokers offering comprehensive educational resources and relatively low commissions are Charles Schwab.

    charles schwab

    Choosing among the best online stock brokers means ranking brokers among the most important characteristics for new traders or investors:

    • Knowledge Bank or Educational Content and Resources
    • Customer Support to assist in order execution and general queries
    • Affordable transaction costs
    • Broad range of investments, including Stocks, Bonds, Mutual Funds, Options, Futures & Forex

    Both Charles Schwab offer a diverse range of mutual funds and exchange-traded funds (ETFs). Exchange-traded funds are index funds that offer exposure to various sectors, such as healthcare, finance, technology, currencies, and much more. Some ETFs are commission-free and some mutual funds have no transaction fees. If you are unsure, customer support can assist you in finding out.

    Schwab provides an ETF Portfolio Builder tool which examines risk tolerance and creates a diversified ETF portfolio that is customized to each individual’s reward and risk preferences.

    Schwab encourages investors to grow their portfolios steadily over time by waiving account minimums for monthly automatic deposits over $100.

    Overall Best Online Stock Brokers When Opening An Account

    Many brokers require a minimum amount before an account may be opened. These online stock brokers have no minimum balance requirement to open an account.

    merrill edge
    etrade

    MerrillEdge offers a compelling value proposition to mutual fund investors, providing over 5,000 no-transaction fee funds. E*Trade offers approximately 1,300 no-transaction fee mutual funds by comparison.

    For beginners, Merrill Edge and E*Trade come top of the list. Merrill is also more attractive due to it being cheaper by $3 per trade relative to ETrade. Plus, Merrill charges $49.95 to close accounts versus $60 at E*Trade.

    Merrill also stands out for its heightened customer service focus with more than 2,000 offline outlets for customers to visit and meet face-to-face with Merrill Edge Financial Solutions Advisors.

    For a taxable, non-qualified, account, ETrade does have a minimum $500 balance requirement, but for a qualified account, such as an IRA, the requirement is $0.

    Other online stock brokers with no minimum deposit requirements, include:

    • OptionsHouse
    • Firstrade
    • TradeKing
    • Capital One Investing

    Best Online Stock Brokers for Customer Service

    Brokers offering phone, online chat, and in-person customer support are vital to new traders and investors. Below is a list of online stock brokers who excel at customer support.

    scottrade logo
    • Standout Feature
      Scottrade ELITE desktop-based platform
    • Commissions
      Stocks: $6.95 per trade; Options: $6.95 + $0.70 per contract
    • Account Minimum
      $2,500 for brokerage; $0 for IRAs
    fidelity investments

    ScottTrade and Fidelity stand out from their online stock broker peers by having an offline presence too. Each of their websites has information on where you can find the nearest local branch where you can speak to someone in person.

    With increased customer service comes increased cost, and both ScottTrade and Fidelity have relatively high minimum account requirements for non-qualified accounts.

    Their heightened focus on customer service extends to education, live webinars, virtual online chat features, and phone support.

    Best Online Stock Brokers for Transaction Costs

    Inactivity fees are one of the hidden expenses at many brokers. To avoid such hidden expenses and keep trading expenses low overall, consider the low-transaction cost brokers below.

    tastytrade (previously known as tastyworks)
    • Standout Feature
      Closing trades for Stocks & ETFs and Options are commission-free
    • Commissions
      $0 flat rate for stocks
    • Account Balance Minimum
      $0
    robinhood logo

    Robinhood has limited educational tools, screening analytics and research but the transaction costs cannot be beaten: $0 trade commissions, $0 account minimum and access to over 5,000 stocks and ETFs. Robinhood supports non-qualified, taxable accounts only.

    TastyWorks is almost as compelling with just $5 stock opening trade. For more seasoned investors who wish to trade options, TastyWorks offers a compelling $0 commission on all closing trades. The charge for opening an options trade is just $1 per contract and for a futures opening trade it is $2.50 per contract.

    Best Online Stock Brokers for Mutual Funds and ETFs

    Brokers offering $0 transaction fees for mutual funds and low-cost ETFs are below.

    charles schwab
    vanguard investments

    Vanguard made its reputation as a provider of low-cost mutual funds while Schwab pioneered affordable online investing. Vanguard is the default choice for many beginner investors but both Schwab and Vanguard have their merits. Both Vanguard and Schwab offer zero commission ETFs and zero commission mutual funds.

    Typically, only mutual funds on a stock brokers list are available for trading with that broker. If you find a mutual fund that is not on the list, some brokers will not add it, and others like Schwab may charge a hefty fee, as high as $76.

    Schwab offers its Mutual Fund OneSource Platform to investors with capital  amounts as low as $100. Schwab also offers a choice of about 200 commission-free ETFs. The per trade rate at Schwab is $4.95.

    Vanguard has a high hurdle of $1,000 to invest in many of its funds. Commission-based ETFs will cost money at the rate of $7 per first 25 trades and $20 thereafter for balances under $50k. Vanguard has no minimum requirement to open an account and offers over 50 commission-free ETFs, fewer than Schwab.

  • Robinhood IRA Review 2026: Match, Fees & Investment Choices

    Robinhood IRA Review 2026: Match, Fees & Investment Choices

    Robinhood IRA Review 2026: Match Rules, Investment Choices, Fees, and Who Should Use It

    Robinhood’s IRA stands out for one reason: eligible customers can receive a contribution match that is uncommon among brokerage IRAs. A standard customer may receive a 1% match, while a Robinhood Gold subscriber may qualify for a 3% match. For someone contributing the 2026 maximum of $7,500, those rates could produce a $75 or $225 match before investment growth.

    The offer comes with important conditions. The highest match requires a paid Gold subscription, and investors generally must keep qualifying funds in the IRA for at least five years to avoid a potential Early IRA Match Removal Fee. Robinhood also lacks mutual funds, individual bonds, target-date funds, and some of the retirement-planning resources available at larger brokers.

    Important: Robinhood can change its match rates, eligibility requirements, subscription conditions, and retention rules. Review the current IRA Match FAQ, fee schedule, and account agreement before depositing or transferring money.

    Robinhood IRA Review: Quick Verdict

    A Robinhood IRA is best suited to beginners, existing Robinhood customers, and long-term investors who want to build a retirement portfolio with stocks and exchange-traded funds, or ETFs. Its simple interface, $0 account minimum, and advertised commission-free stock and ETF trades make it relatively easy to start investing.

    The potential 1% to 3% IRA match makes Robinhood more compelling, especially for investors who already pay for Robinhood Gold or contribute enough to offset the subscription cost. However, the match should not distract from portfolio quality, tax considerations, or the five-year retention requirement.

    Who this account is best for

    • Beginning investors who want a streamlined mobile experience.
    • Existing Robinhood users who prefer keeping investments in one app.
    • Long-term investors willing to leave matched contributions in the IRA for at least five years.
    • Investors who use ETFs instead of mutual funds or target-date funds.
    • Gold subscribers who can obtain enough value from the higher match and other membership benefits.

    Who may be better served elsewhere

    • Investors who regularly move accounts between brokerages.
    • People who want mutual funds, individual bonds, or target-date retirement funds.
    • Investors seeking extensive retirement calculators, financial planning, or in-person support.
    • People likely to withdraw or transfer matched funds within five years.
    • Small contributors who would subscribe to Gold solely for the additional match.

    Who Should Use a Robinhood IRA in 2026?

    Robinhood is a reasonable choice for a self-directed investor who knows how to select a diversified ETF portfolio—or is willing to learn. A beginner could, for example, use a broad U.S. stock-market ETF and an international-stock ETF rather than trying to select dozens of individual companies.

    The account is also attractive to investors who expect to remain with Robinhood for several years. The match is most valuable when the investor can satisfy the retention rules without changing a financial plan merely to preserve a bonus.

    Gold members have a stronger case because the advertised match rises from 1% to 3% on eligible contributions. That does not automatically make Gold worthwhile, however. The subscription cost must be compared with the additional match and any other benefits the customer will actually use.

    Robinhood is less suitable for someone who wants a complete retirement ecosystem. Fidelity, Charles Schwab, and Vanguard generally offer broader fund lineups, including mutual funds and target-date funds, along with more extensive retirement research and planning resources.

    Robinhood IRA Match Rules and 2026 Contribution Limits

    Robinhood has advertised a 1% match on eligible self-directed IRA contributions for non-Gold customers and a 3% match for qualifying Robinhood Gold subscribers. The matching money can generally be invested after it is credited, but receiving a match does not increase the amount an investor is legally allowed to contribute.

    2026 IRA contribution limits

    • Under age 50: Up to $7,500 across Traditional and Roth IRAs.
    • Age 50 or older: Up to $8,600, including the catch-up contribution.

    The limit applies across all of a person’s Traditional and Roth IRAs, not separately to each account. Contributions also cannot exceed eligible compensation for the year. Roth IRA income limits and other eligibility rules may further restrict how much a person can contribute.

    How much could the contribution match be?

    For an investor under age 50 who contributes the full $7,500:

    • 1% match: $7,500 × 0.01 = $75.
    • 3% match: $7,500 × 0.03 = $225.
    • Extra match from Gold: $225 minus $75 = $150.

    For an eligible investor age 50 or older who contributes $8,600, a 1% match would equal $86 and a 3% match would equal $258.

    Matching funds provided by a brokerage generally do not count as the customer’s own annual IRA contribution, but investors should confirm Robinhood’s current disclosures and consult a tax professional about unusual circumstances.

    Contributions, transfers, and rollovers may be treated differently

    A direct annual contribution is not the same as transferring an existing IRA or rolling over an old 401(k). Robinhood has offered matches on transfers and rollovers, but those promotions can use different rates, deadlines, minimums, and holding requirements.

    Do not assume that a 3% contribution match also applies to an IRA transfer or 401(k) rollover. Check which transaction qualifies before initiating it. A properly completed transfer or rollover normally does not use the annual contribution limit, but an incorrect rollover can create taxes or penalties.

    The Gold subscription and five-year rules

    Under reported Gold match terms, customers may need to remain subscribed to Robinhood Gold for at least one year after their first eligible deposit to retain the full Gold match. Funds that earned a match generally must remain in the Robinhood IRA for at least five years.

    Removing qualifying funds early can trigger an Early IRA Match Removal Fee or the loss of the corresponding match. Separately, an IRA withdrawal may create income taxes and an IRS early-distribution penalty depending on the account type, the investor’s age, and the reason for the withdrawal.

    These rules make the promotion better suited to genuinely long-term retirement money than cash an investor may need soon.

    Investment Choices: What You Can and Cannot Buy

    A self-directed Robinhood IRA generally supports individual stocks, ETFs, and certain options strategies. That selection is enough to create a diversified portfolio, but it is narrower than the investment menu at many full-service brokers.

    What is available

    • U.S.-listed individual stocks.
    • Broad-market, sector, bond, and specialty ETFs.
    • Certain options strategies for approved accounts.
    • Fractional investing in eligible securities, subject to current availability.

    What is missing

    • Traditional mutual funds.
    • Target-date mutual funds.
    • Direct purchases of individual Treasury, municipal, and corporate bonds.

    The lack of mutual funds matters most to investors rolling over a workplace plan. A target-date fund automatically combines multiple asset classes and gradually becomes more conservative. At Robinhood, an investor may need to recreate that exposure with ETFs and periodically rebalance the portfolio.

    For example, a simple ETF allocation could combine a U.S. total-market ETF, an international-stock ETF, and a broad bond ETF. The appropriate percentages depend on time horizon, risk tolerance, and financial circumstances; there is no universally correct allocation.

    Risks of stocks and options inside an IRA

    Commission-free trading can make frequent activity feel inexpensive, but concentrated stock positions and options can expose retirement savings to substantial losses. An IRA also does not provide an immediate tax deduction for investment losses, and losses generally cannot be used to offset gains in a taxable brokerage account.

    Cryptocurrency access, trading features, and IRA eligibility should be confirmed in Robinhood’s current account disclosures. Availability in a regular brokerage account does not necessarily mean the same asset can be held in an IRA.

    Self-directed IRA versus Robinhood Strategies

    A self-directed IRA leaves investment selection and rebalancing to the customer. Robinhood Strategies is a managed-account service that selects and manages a portfolio for the investor. Reported terms indicate that the standard IRA contribution match applies to self-directed IRAs, not managed IRAs, so confirm eligibility before choosing a managed portfolio.

    Robinhood IRA Fees, Minimums, and Gold Costs

    Robinhood advertises a $0 minimum and $0 commissions for online trades of eligible stocks and ETFs. “Commission-free” does not mean every transaction is free: regulatory charges, options-related fees, index-option charges, account-transfer fees, and other costs may apply.

    Cost or feature Reported 2026 terms What to check
    Self-directed IRA minimum $0 Minimum investment requirements for individual securities
    Stock and ETF commissions Generally $0 for eligible online trades Regulatory, transaction, and product-specific fees
    Robinhood Gold Approximately $5 monthly or $50 annually Current price and renewal terms
    Robinhood Strategies 0.25% annual management fee Eligible Gold subscribers may pay no fee on assets above $100,000, effectively capping the stated fee at $250 annually
    Transfer-fee reimbursement Reported reimbursement of up to $75 for qualifying IRA transfers of at least $7,500 Current minimum, documentation deadline, and eligible transfer types

    Does Gold break even?

    At a $50 annual price, a 3% match equals $50 at approximately $1,667 of eligible contributions. That calculation compares the gross 3% match with the subscription price:

    $50 ÷ 0.03 = approximately $1,667

    However, non-Gold customers may already receive a 1% match. If Gold is purchased solely to increase the match from 1% to 3%, the relevant benefit is the extra two percentage points. On that basis, the annual break-even contribution is approximately $2,500:

    $50 ÷ 0.02 = $2,500

    A customer contributing $1,000 would receive an additional $20 from the higher match, which would not offset a $50 annual subscription by itself. A customer contributing $7,500 would receive an additional $150, producing a $100 first-year advantage after a $50 annual fee, before considering taxes, investment performance, future pricing, or other Gold benefits.

    Traditional IRA vs. Roth IRA at Robinhood

    Robinhood offers both Traditional and Roth IRAs. The investment interface may be similar, but the tax treatment is different.

    Feature Traditional IRA Roth IRA
    Contributions May be tax-deductible, subject to income and workplace-plan rules Made with after-tax money
    Investment growth Tax-deferred Potentially tax-free
    Qualified withdrawals Generally taxed as ordinary income Generally tax-free when IRS requirements are satisfied
    Income restrictions Deduction eligibility may be limited Direct contributions phase out at higher incomes

    A Roth IRA can be attractive to someone who expects a higher future tax rate, while a deductible Traditional IRA contribution may provide a current-year tax benefit. The better choice depends on income, workplace retirement coverage, filing status, expected future tax rates, and withdrawal plans.

    Converting a Traditional IRA to a Roth IRA can create taxable income in the conversion year. Robinhood provides the account structure, but it does not provide individualized tax advice. Check current IRS income thresholds or consult a qualified tax professional before contributing or converting.

    According to current reported product limitations, Robinhood offers Traditional and Roth IRAs but not SEP, SIMPLE, or custodial IRAs. Business owners and parents seeking those account types may need another provider.

    Robinhood IRA Pros and Cons

    Pros

    • Potential 1% match for eligible customers and 3% for qualifying Gold subscribers.
    • $0 account minimum.
    • Generally commission-free stock and ETF trades.
    • Simple interface and relatively fast account setup.
    • Broad ETF availability for building a diversified portfolio.

    Cons

    • Five-year retention requirement associated with matched funds.
    • Gold subscription required for the highest contribution match.
    • No mutual funds or target-date mutual funds.
    • No direct individual-bond purchases.
    • Fewer retirement-planning tools than some full-service brokers.
    • Match terms can vary between contributions, transfers, and rollovers.

    Alternatives to a Robinhood IRA

    Fidelity may be a better choice for investors who want mutual funds, extensive research, retirement calculators, and a broad range of account types.

    Charles Schwab offers a wider retirement platform, mutual funds, bond access, research, and branch-based support for customers who value in-person service.

    Vanguard remains a natural option for long-term investors interested in Vanguard mutual funds, target-date retirement funds, and a traditional buy-and-hold experience.

    Betterment or another robo-advisor may suit investors who want automated asset allocation, recurring deposits, and rebalancing. The trade-off is an ongoing management fee and less control over individual investment selection.

    What to Do Next

    Before opening the account

    1. Read Robinhood’s current match terms, including Gold and five-year retention requirements.
    2. Confirm whether your deposit is a contribution, IRA transfer, or workplace-plan rollover.
    3. Calculate Gold’s value using the additional 2% match—not just the headline 3% rate.
    4. Choose between a Traditional and Roth IRA based on current tax rules and your circumstances.
    5. Verify that Robinhood offers the investments and account features you need.

    After funding the IRA

    1. Invest the cash according to a diversified long-term plan rather than leaving it unintentionally idle.
    2. Confirm that the expected match was credited correctly.
    3. Track contributions across every IRA to avoid exceeding the annual limit.
    4. Keep records of contributions, transfers, rollovers, matches, and Gold subscription dates.
    5. Review the portfolio periodically and rebalance when necessary.

    Bottom line: Robinhood’s IRA can be a strong fit for investors who prefer ETFs, value a simple interface, and can satisfy the match conditions. The 3% Gold match is potentially worthwhile for larger annual contributions, but the account’s limited fund selection and five-year restriction make it less suitable for frequent account movers or investors who want comprehensive retirement planning. Treat the match as an added benefit—not as a substitute for choosing the right IRA type, investments, and long-term strategy.

    This article is for general educational purposes and is not individualized investment, tax, or legal advice. Fees, match offers, eligibility rules, tax limits, and product availability can change.

  • Mortgage APR vs. Interest Rate: Compare True Loan Costs

    Mortgage APR vs. Interest Rate: Compare True Loan Costs

    Mortgage APR vs. Interest Rate: How to Compare Points, Fees, and Total Closing Costs

    Two mortgage offers can advertise the same interest rate yet have meaningfully different upfront costs. Conversely, the loan with the lowest rate may require thousands of dollars more at closing. Understanding mortgage APR vs. interest rate helps you identify these tradeoffs before committing to a lender.

    The interest rate determines the interest charged on your outstanding loan balance and drives your monthly principal-and-interest payment. The annual percentage rate, or APR, combines that rate with certain borrowing costs and expresses the result as an annualized percentage. Neither number, however, tells you everything about your cash needed at closing or whether paying points makes sense for your expected holding period.

    Mortgage APR vs. Interest Rate: The Key Difference

    A mortgage interest rate measures the cost of borrowing the loan principal. If you take out a fixed-rate mortgage at 6.75%, the rate used to calculate your scheduled principal-and-interest payments remains 6.75% for the loan term.

    APR is a broader cost measure. It reflects the interest rate plus eligible charges such as discount points, mortgage broker fees, origination charges, and certain other costs required to obtain the loan. Those costs are converted into an annualized percentage based on the loan’s repayment schedule.

    Because APR incorporates more than interest, it is usually higher than the note rate. The difference between the two can offer a quick indication of how much a lender is charging in eligible fees. A relatively wide gap may signal substantial points or lender charges, although it does not automatically mean the loan is a poor choice.

    Measure What It Shows What It Helps You Compare
    Interest rate The rate charged on the outstanding principal Monthly principal-and-interest payments and interest expense
    APR The interest rate plus eligible borrowing costs, annualized The broader cost of comparable loans if held according to the APR assumptions
    Estimated cash to close The expected amount due at closing after credits and deposits Immediate cash requirements

    The distinction is important: your interest rate—not the APR—is generally used to calculate the scheduled principal-and-interest payment. APR is primarily a disclosure and comparison tool.

    What Mortgage Points Do to Your Rate and APR

    A discount point is an upfront charge paid in exchange for a lower interest rate. One point equals 1% of the loan amount.

    • On a $200,000 mortgage, one point costs $2,000.
    • On a $300,000 mortgage, one point costs $3,000.
    • On a $500,000 mortgage, one point costs $5,000.

    The rate reduction associated with one point is not fixed. It depends on the lender, loan program, market conditions, occupancy, credit profile, and rate-lock period. A lender might offer a $300,000 loan at 6.75% with no points and a lower rate for $3,000 in points, but the exact lower rate must be confirmed through a written quote.

    Paying points can reduce the monthly payment and total scheduled interest if you keep the mortgage long enough. It also increases the cash required upfront. Because discount points are an eligible finance charge, they generally affect the APR.

    Discount Points vs. Lender Credits

    Lender credits work in the opposite direction. You accept a higher interest rate, and the lender provides a credit that offsets some closing costs. This structure can be useful when preserving cash matters more than securing the lowest possible payment.

    • Discount points: More cash at closing in exchange for a lower rate.
    • Zero-point option: No discount points, with pricing between the other choices.
    • Lender credits: Less cash at closing in exchange for a higher rate.

    Requesting all three options from the same lender makes the tradeoff visible. Compare the rate, APR, monthly payment, lender fees, credits, and estimated cash to close for each version.

    Which Fees and Closing Costs Affect APR?

    APR does not simply equal the interest rate plus every dollar shown on the closing statement. Federal disclosure rules determine which costs are treated as finance charges, and the treatment can depend on the nature of the fee.

    Charges that commonly affect mortgage APR include:

    • Discount points
    • Loan origination charges
    • Underwriting or processing fees charged by the lender
    • Mortgage broker compensation paid by the borrower
    • Prepaid interest covering the period between closing and the first full payment cycle
    • Certain other charges required to obtain the loan

    Lender-controlled costs deserve particular attention because they are often easier to compare directly. These appear primarily in the origination-charge section of the Loan Estimate and may include points, application fees, underwriting charges, or processing fees.

    Third-Party Costs and Cash to Close

    Third-party expenses can include appraisal charges, credit-report fees, title searches, title insurance, settlement services, recording charges, surveys, and inspections. Some charges may be excluded from the APR calculation when they meet applicable regulatory conditions. Others may receive different treatment depending on who requires the service and how the fee is assessed.

    Property taxes, homeowners insurance premiums, prepaid insurance, and initial escrow deposits can substantially increase cash to close without necessarily increasing APR. This is why an APR comparison cannot replace a line-by-line review of closing costs.

    When comparing offers, separate expenses into three practical groups:

    1. Rate and lender pricing: Points, lender credits, origination, and underwriting fees.
    2. Third-party services: Appraisal, title, settlement, recording, and similar costs.
    3. Property-related prepayments: Taxes, insurance, prepaid interest, and escrow funding.

    Ask each lender to identify the specific fees included in its quoted APR. That is especially useful when two offers appear similar but show different APRs.

    A Real-Number APR Comparison

    Consider two estimated offers for the same $300,000, 30-year fixed-rate mortgage. Both carry a 6.75% interest rate, and neither set of costs is financed into the loan balance.

    Loan Feature Offer A Offer B
    Loan amount $300,000 $300,000
    Interest rate 6.75% 6.75%
    APR-eligible points and fees $3,000 $1,500
    Estimated APR Approximately 6.85% Approximately 6.80%
    Monthly principal and interest Approximately $1,946 Approximately $1,946
    Total scheduled interest over 30 years Approximately $400,500 Approximately $400,500
    Upfront eligible costs $3,000 $1,500

    These figures are estimates and exclude taxes, insurance, mortgage insurance, and other closing costs. Because the two loans have the same amount, term, and interest rate, they produce the same scheduled principal-and-interest payment and total interest. Offer A has the higher estimated APR because the borrower pays more eligible upfront costs.

    Assuming the remaining closing-cost items are identical, Offer B would also require $1,500 less at closing. This is a clean example of APR exposing a fee difference that the interest rate alone does not reveal.

    Why the Lowest APR May Still Require More Cash

    Across loans with different interest rates, the lowest APR does not necessarily correspond to the lowest upfront cost. A borrower might pay $6,000 in discount points to obtain a lower rate and APR, while another option offers a higher rate with no points and a lender credit.

    The points option could look less expensive when costs are annualized over 30 years, yet require considerably more cash on closing day. If the borrower sells or refinances after three years, there may not have been enough monthly savings to recover the upfront payment.

    How to Compare Mortgage Offers on the Loan Estimate

    The standardized Loan Estimate provides the most useful starting point for comparing written mortgage offers. According to the Consumer Financial Protection Bureau, the interest rate appears under “Loan Terms” on page 1, while APR appears under “Comparisons” on page 3.

    Use the following process:

    1. Match the loan structure. Compare the same loan type, loan amount, term, occupancy status, down payment, and fixed- or adjustable-rate structure.
    2. Match the timing. Mortgage pricing can change daily. Compare offers issued close together and verify whether each rate is locked.
    3. Compare lock periods. A 30-day lock and a 60-day lock may carry different pricing.
    4. Review page 1. Check the interest rate, projected principal-and-interest payment, mortgage insurance, and whether the payment can change.
    5. Review origination charges. Identify points, underwriting fees, application charges, and other lender-controlled costs.
    6. Find lender credits. Confirm whether a credit is tied to accepting a higher rate.
    7. Check page 3. Compare APR and the “In 5 Years” figures, but verify that the offers use matching assumptions.
    8. Review estimated cash to close. Include the down payment, closing costs, deposits, credits, and other adjustments.

    Do not compare a conventional 30-year fixed loan with an adjustable-rate mortgage solely by APR. An adjustable loan’s future rate depends on its index, margin, adjustment schedule, and caps, so additional assumptions are necessary.

    Break-Even Point: When Do Points Pay Off?

    The break-even period estimates how long it takes for the monthly savings from a lower rate to recover the cost of discount points.

    Break-even months = upfront points cost ÷ monthly payment savings

    Suppose one point costs $3,000 and lowers the principal-and-interest payment by $50 per month:

    $3,000 ÷ $50 = 60 months

    The simplified break-even point is five years. If you expect to keep the mortgage longer than five years, paying the point may produce savings after the break-even date. If you expect to sell or refinance in three years, the no-point option may cost less over your actual holding period.

    Before relying on the result, consider:

    • How long you realistically expect to own the home
    • Whether you may refinance if rates change
    • The value of keeping cash available for repairs, emergencies, or other goals
    • Differences in loan balances if costs are financed
    • The interest or investment return that upfront cash could otherwise earn
    • Whether points qualify for a tax deduction under your circumstances

    Tax treatment depends on factors such as the loan’s purpose, the property, how the points are paid, and whether applicable IRS requirements are satisfied. Consult a qualified tax professional rather than assuming the full cost will be immediately deductible.

    Break-even analysis also requires extra care for refinances and adjustable-rate mortgages. Refinance calculations should account for the existing loan, financed closing costs, and any extension of the repayment period. Adjustable-rate comparisons need assumptions about future index values and rate changes.

    What to Do Next Before Choosing a Mortgage

    1. Request Loan Estimates from at least three lenders within a comparable shopping period.
    2. Give every lender the same loan amount, down payment, property type, loan program, and desired lock period.
    3. Ask each lender for zero-point, one-point, and lender-credit options.
    4. Compare the interest rate, APR, principal-and-interest payment, lender fees, credits, and cash to close together.
    5. Ask which charges are included in each quoted APR.
    6. Calculate the break-even period for every option involving discount points.
    7. Use a mortgage calculator to test costs over the number of years you expect to keep the loan—not only over the full term.

    APR is valuable because it converts many borrowing costs into a standardized percentage, but it is not a personalized recommendation. The most suitable mortgage depends on your expected holding period, available cash, refinancing plans, and tolerance for a higher monthly payment. Compare the rate, APR, fees, and cash to close as a package before deciding.

    This article provides general educational information and is not individualized financial, tax, or legal advice. Mortgage pricing and disclosures vary by loan program and borrower circumstances.

  • Betterment vs. Fidelity Go: Best Taxable Account in 2026

    Betterment vs. Fidelity Go: Best Taxable Account in 2026

    Betterment vs. Fidelity Go for Taxable Accounts in 2026: Fees, Tax-Loss Harvesting, and Portfolio Control

    Choosing between Betterment and Fidelity Go for a taxable account involves more than comparing two advisory rates. Tax-loss harvesting, underlying fund expenses, portfolio flexibility, access to financial professionals, and investments held in outside accounts can all affect which service is the better fit.

    Betterment generally provides more portfolio choices and broader automated tax management. Fidelity Go stands out for charging no advisory fee on balances below $25,000 and for integrating with Fidelity’s broader brokerage, retirement, and cash-management ecosystem.

    Important: Pricing, eligibility thresholds, and account features can change. Confirm current fees, portfolio options, tax-management rules, and support benefits on each provider’s website before opening or funding an account.

    Quick Verdict: Which Robo-Advisor Fits Your Taxable Account?

    Betterment may be the stronger fit if automated tax-loss harvesting is a priority or you want a wider selection of ETF-based portfolio strategies. Betterment can be particularly useful for taxable investors who regularly contribute, expect to realize capital gains, or want tax management without first reaching Fidelity Go’s $25,000 threshold.

    Fidelity Go may be the stronger fit if you already use Fidelity, prefer a simple managed portfolio, or expect to maintain a balance below $25,000. Fidelity Go charges no advisory fee below that level. However, tax-loss harvesting and financial coaching generally become available only after the account reaches $25,000.

    Tax-loss harvesting applies only to taxable investment accounts. It does not provide the same benefit inside IRAs, Roth IRAs, 401(k)s, or other tax-advantaged retirement accounts because trades within those accounts do not generate currently taxable capital gains or deductible capital losses.

    Betterment vs. Fidelity Go: Key Differences at a Glance

    Feature Betterment Digital Betterment Premium Fidelity Go
    Advisory fee $5 per month below $24,000 unless the account has at least $200 in qualifying monthly recurring deposits; otherwise 0.25% annually 0.65% annually on the first $1 million in eligible balances, consisting of the 0.25% Digital fee plus a 0.40% Premium fee No advisory fee below $25,000; 0.35% annually on the account balance at $25,000 or more
    Minimum balance No substantial minimum to open, but the pricing method depends on balance and recurring deposits $100,000 minimum eligible investment balance No minimum to open; the $25,000 threshold controls access to certain features and paid pricing
    Underlying investments Diversified exchange-traded funds Diversified exchange-traded funds Fidelity Flex mutual funds with zero fund expense ratios
    Tax-loss harvesting Available for eligible taxable accounts Available for eligible taxable accounts Available for taxable accounts with at least $25,000
    Automatic rebalancing Yes Yes Yes
    Portfolio customization Multiple portfolio strategies and some allocation flexibility Multiple strategies plus planning support Limited customization beyond risk selection and reasonable investment restrictions
    Socially responsible options Available through selected portfolio strategies Available through selected portfolio strategies Generally no dedicated socially responsible or specialty portfolio
    Human support Digital guidance; separate advice packages may be available Access to financial professionals and planning support Unlimited 30-minute coaching calls for eligible accounts with at least $25,000
    Cryptocurrency access Crypto ETF portfolios are available and are generally subject to the standard Digital management fee Crypto ETF portfolios are available and are generally subject to the standard Premium management fee Not included in the standard Fidelity Go portfolio

    Betterment primarily builds portfolios from ETFs issued by multiple fund companies. That structure supports a broader menu of portfolio strategies, but investors also bear the expense ratios charged by the selected ETFs.

    Fidelity Go uses proprietary Fidelity Flex mutual funds. These funds have zero expense ratios, simplifying the underlying fund cost, although the available portfolio choices are more limited.

    Fees and Minimums in 2026

    Betterment Digital fees

    Betterment Digital charges $5 per month when an eligible investment balance is below $24,000 and the customer does not make at least $200 in qualifying recurring deposits each month. The monthly charge totals $60 per year.

    Accounts with at least $24,000, as well as qualifying smaller accounts with at least $200 in monthly recurring deposits, are generally charged 0.25% annually instead. This distinction is important for smaller balances. On a $10,000 account, $60 per year represents an effective advisory cost of 0.60%. If the same account qualifies for percentage-based pricing, the annual advisory fee would be approximately $25.

    Betterment Premium fees

    Betterment Premium requires at least $100,000 in eligible investment balances. The annual fee is 0.65% on the first $1 million in eligible balances. That total consists of Betterment’s 0.25% Digital base fee plus an additional 0.40% Premium fee for access to financial professionals and expanded planning support.

    The 0.40% figure should not be treated as Premium’s complete advisory charge. At a $100,000 balance, the total 0.65% fee produces an estimated annual advisory cost of $650.

    Fidelity Go fees

    According to Fidelity’s published Fidelity Go pricing, accounts below $25,000 pay no advisory fee. Once an account reaches $25,000, Fidelity charges 0.35% per year on the account balance—not only on the portion above $25,000.

    This creates a significant pricing step. An account just below $25,000 may have no advisory fee, while an account with exactly $25,000 would incur an estimated annual charge of $87.50. Reaching that threshold also unlocks financial coaching and tax-loss harvesting for eligible taxable accounts.

    Estimated annual advisory costs

    Taxable balance Betterment Digital Betterment Premium Fidelity Go
    $10,000 $60 under monthly pricing, or about $25 if eligible for 0.25% pricing through qualifying recurring deposits Not eligible $0
    $25,000 About $62.50 Not eligible About $87.50
    $60,000 About $150 Not eligible because Premium requires $100,000 About $210
    $100,000 About $250 About $650 About $350

    These examples estimate advisory fees only. Betterment investors also pay the expense ratios of the ETFs held in their portfolios. The exact cost varies by portfolio and is deducted within each fund rather than billed as a separate advisory charge.

    Fidelity Go’s Flex funds have zero expense ratios. Fidelity also states that the service does not impose separate trading, transaction, or rebalancing fees. Investors should nevertheless review each provider’s disclosures for transfer policies, uncommon account charges, and expenses associated with investments outside the managed portfolio.

    Tax-Loss Harvesting for Taxable Investors

    Tax-loss harvesting involves selling an investment for less than its tax basis and using the realized loss to offset realized capital gains. Under federal tax rules, excess net capital losses may also offset a limited amount of ordinary income, with unused losses potentially carried into future tax years.

    Betterment’s Tax Loss Harvesting+ is an automated strategy designed to monitor eligible taxable holdings for harvesting opportunities. When the system identifies a suitable loss, it may sell the losing position and purchase a replacement investment intended to preserve similar market exposure.

    Fidelity Go offers tax-loss harvesting for taxable accounts once the account balance reaches $25,000. Fidelity looks for harvesting opportunities in eligible Fidelity Flex funds that hold stocks. Accounts below $25,000 do not receive this feature.

    Wash-sale risk requires a broader review

    The wash-sale rule can defer a loss if an investor purchases the same or a substantially identical security within 30 days before or after the loss-producing sale. A robo-advisor may monitor activity inside the account it manages, but it may not have a complete view of transactions in outside accounts.

    Potential conflicts can arise through a spouse’s account, an IRA, a workplace retirement plan, another brokerage account, or an automatic dividend-reinvestment program. For example, if a robo-advisor sells a fund at a loss while the investor automatically purchases the same fund elsewhere, the transaction could create a wash sale.

    Investors should therefore compare the robo-advisor’s holdings with funds owned across their household. Turning off dividend reinvestment in an overlapping security may sometimes reduce accidental purchases during a wash-sale window, although individual tax circumstances should be reviewed with a qualified professional.

    Tax-loss harvesting is tax deferral, not guaranteed savings

    Harvesting a loss generally lowers the tax basis of the replacement investment. If that replacement is later sold for a gain, the investor may face a larger future tax bill. The strategy can still be useful when losses offset short-term gains, when the investor expects to be in a lower future tax bracket, or when taxes can be deferred for many years.

    A replacement fund can also perform differently from the original investment. Neither provider guarantees that harvesting opportunities will arise or that the strategy will reduce an investor’s lifetime taxes. Results depend on market movements, deposits, withdrawals, holding periods, other transactions, and federal and state tax rules.

    Portfolio Control, Investments, and Customization

    Betterment offers the broader investment menu. Its portfolios generally use diversified ETFs, and investors can select from multiple strategies, including socially responsible choices and portfolios with different income, factor, or risk characteristics. The available allocation controls depend on the chosen strategy.

    Betterment also offers Crypto ETF portfolios. These portfolios are generally subject to Betterment’s standard management fees under the Digital or Premium plan rather than a separate management-pricing model. The underlying crypto-related ETFs may still have their own fund expenses, and the portfolios can experience substantial volatility and other cryptocurrency-specific risks.

    Fidelity Go emphasizes simplicity. It recommends an allocation using the investor’s stated goal, time horizon, and risk tolerance, then implements that allocation with Fidelity Flex mutual funds. Fidelity monitors and rebalances the portfolio and may accept reasonable investment restrictions, but it generally offers fewer specialty strategies and customization choices than Betterment.

    Both services are built for hands-off management. That convenience limits investor control. Someone who wants to select exact ETFs, own individual stocks, control the timing of every trade, or choose which tax lots to sell may prefer a self-directed brokerage account.

    Human Advice, Usability, and Fidelity Ecosystem Benefits

    Betterment Premium combines automated portfolio management with access to financial professionals. The service may appeal to investors seeking help with retirement planning, stock compensation, multiple financial goals, or major financial decisions. Customers should review the service agreement to understand the scope of the advice and whether support comes from a dedicated professional or a team.

    Fidelity Go customers with at least $25,000 generally receive unlimited 30-minute coaching calls. These sessions can address budgeting, debt, retirement preparation, and goal planning. Coaching can be useful, but it should not automatically be treated as comprehensive tax planning or an ongoing relationship with a dedicated financial planner.

    Both providers offer web and mobile access, automatic deposits, goal tracking, portfolio monitoring, and planning tools. Betterment’s experience is organized heavily around financial goals and automated recommendations.

    Fidelity’s main usability advantage is account integration. Existing customers may be able to view Fidelity Go alongside self-directed brokerage accounts, IRAs, workplace retirement plans, cash-management accounts, and other Fidelity relationships. That consolidated view can make it easier to monitor household assets, although it does not eliminate the need to check for overlapping investments held elsewhere.

    Automated recommendations are only as reliable as the information supplied. Investors should update their income, liquidity needs, risk tolerance, target dates, and financial goals after a job change, major purchase, inheritance, marriage, or other material event.

    Pros, Cons, and Alternatives

    Betterment pros

    • Automated tax-loss harvesting for eligible taxable accounts without Fidelity Go’s $25,000 feature threshold.
    • Broader selection of ETF-based portfolio strategies.
    • Socially responsible choices and other portfolio variations.
    • Goal-based tools and optional access to financial professionals.

    Betterment cons

    • The $5 monthly fee can represent a relatively high percentage of a small balance.
    • ETF expense ratios are paid in addition to the advisory fee.
    • Premium requires a $100,000 eligible investment balance and costs 0.65% annually on the first $1 million.
    • Crypto ETF portfolios carry substantial volatility and underlying fund expenses.

    Fidelity Go pros

    • No advisory fee on balances below $25,000.
    • Fidelity Flex funds have zero expense ratios.
    • Strong integration for investors with other Fidelity accounts.
    • Tax-loss harvesting and unlimited financial coaching become available at $25,000.

    Fidelity Go cons

    • The 0.35% fee applies to the account balance once it reaches $25,000.
    • Tax-loss harvesting and financial coaching are unavailable below that threshold.
    • Portfolio customization is limited.
    • The standard service generally lacks specialty and socially responsible portfolio strategies.

    Alternatives worth considering

    Schwab Intelligent Portfolios does not advertise a conventional advisory fee for its basic automated service, but portfolios include a cash allocation. That cash can create an opportunity cost and is part of the program’s business model.

    Vanguard Digital Advisor may appeal to long-term, index-focused investors seeking automated management. Compare its current minimum, net advisory fee, fund lineup, and taxable-account capabilities before deciding.

    A self-directed Fidelity brokerage account offers more control without a robo-advisory fee. It may work for an investor who is comfortable selecting diversified funds, rebalancing periodically, maintaining tax records, and managing tax-loss harvesting manually. The trade-off is the time and tax awareness required.

    Who Is Each Service Best For?

    Consider Betterment if taxable-account automation is central to the decision, you want tax-loss harvesting below $25,000, or you value multiple portfolio strategies more than consolidating every account at Fidelity.

    Consider Fidelity Go if the account will remain below $25,000, you prefer funds with zero expense ratios, or Fidelity account integration matters more than expanded portfolio customization.

    At balances of $25,000 or more, compare the complete cost against the features you expect to use. Betterment Digital’s 0.25% advisory rate is lower than Fidelity Go’s 0.35%, although Betterment portfolios also incur ETF expense ratios. Fidelity Go uses zero-expense-ratio Flex funds and includes financial coaching at this balance level.

    At $100,000, Betterment customers face another choice: remain with Digital at approximately $250 per year or select Premium at approximately $650 per year. Premium is most relevant when access to financial professionals is valuable enough to justify the additional 0.40% charge.

    The value of tax-loss harvesting should not be assumed. An investor with few taxable gains, a low current tax rate, substantial wash-sale exposure, or a short investment horizon may receive less benefit than someone with recurring capital gains and many years to defer future taxes.

    What to Do Next Before Choosing

    1. Estimate the full annual cost. Apply the correct advisory pricing to the planned balance, then add estimated ETF expense ratios or other portfolio-level expenses.
    2. Check Betterment’s pricing conditions. For a balance below $24,000, determine whether at least $200 in qualifying monthly recurring deposits will make the account eligible for 0.25% annual pricing instead of the $5 monthly fee.
    3. Check Fidelity Go’s $25,000 threshold. Determine whether the account will qualify for tax-loss harvesting and coaching, and consider whether normal market movements could take the balance below the eligibility level.
    4. Review current holdings. Identify unrealized gains, losses, concentrated positions, and funds that could overlap with a robo-advisor’s holdings or replacement securities.
    5. Assess household wash-sale exposure. Include taxable accounts, IRAs, spousal accounts, workplace plans, and automatic dividend reinvestments.
    6. Decide which benefit matters most. Compare Betterment’s broader automated tax management and portfolio flexibility with Fidelity’s ecosystem integration and no advisory fee below $25,000.
    7. Verify current terms. Review each provider’s official pricing page, program disclosure, portfolio methodology, tax-loss harvesting rules, fund expenses, and human-support eligibility before transferring money.

    Bottom line: Betterment generally offers the more flexible taxable-account package, especially for investors who want automated tax-loss harvesting before reaching $25,000. Fidelity Go is compelling for smaller accounts and existing Fidelity customers, but its fee and available features change materially when the balance reaches $25,000.

    This comparison is for educational purposes only and is not personalized investment, tax, accounting, or legal advice. Consider consulting qualified professionals about how either service would interact with your holdings, financial plan, and tax situation.


  • Roth Conversion Sweet Spot: Find Your Lower-Tax Year

    Roth Conversion Sweet Spot: Find Your Lower-Tax Year

    Roth Conversion Sweet Spot: How to Find a Lower-Tax Year Before Your Peak Earning Years

    A Roth conversion can turn tax-deferred retirement savings into a source of potentially tax-free retirement income. The tradeoff is immediate: the taxable portion of the conversion is added to your ordinary income for the year.

    The goal is not simply to convert as much as possible. It is to identify a “Roth conversion sweet spot”—a year when your marginal tax rate is temporarily lower than the rate you reasonably expect to pay on future withdrawals. That opportunity might arise early in your career, during a job transition, or after retirement but before Social Security and required minimum distributions increase your taxable income.

    The right amount depends on more than federal tax brackets. State taxes, deductions, Medicare premiums, health insurance subsidies, IRA basis, and future income can all change the result. The following framework can help you evaluate the decision, but it is not personalized tax, legal, or investment advice.

    What the Roth Conversion Sweet Spot Means

    A Roth conversion moves money from a traditional IRA or another eligible tax-deferred retirement account into a Roth IRA. The portion attributable to deductible contributions and investment earnings is generally taxed as ordinary income in the conversion year. Any properly documented after-tax basis is not taxed again, although the IRA pro-rata rule may affect how much of the conversion is taxable.

    A conversion sweet spot exists when your current marginal tax rate is below the rate you expect to pay if you leave the money in the traditional account and withdraw it later. For example, paying 12% or 22% today may be attractive if future required distributions, Social Security, a pension, or higher household income are likely to place the withdrawals in a 24% or higher bracket.

    The comparison should focus on marginal rates—the rate applied to the next dollar of taxable income—not merely your average tax rate. A conversion is layered on top of your other income and may cross several brackets.

    Timing also matters. A conversion generally must be completed by December 31 to count for that calendar year. Unlike an IRA contribution, it cannot ordinarily be designated for the prior year when completed by the following tax-filing deadline. Custodians may impose earlier processing deadlines, so waiting until the final business day can be risky.

    Your conversion capacity may be affected by:

    • Federal tax brackets for the applicable year
    • Filing status, including a possible future change from married filing jointly to single
    • The standard deduction or itemized deductions
    • State income taxes and residency
    • Capital gains, dividends, pensions, and taxable Social Security benefits
    • Tax credits, phaseouts, and income-based healthcare costs

    Why Peak Earning Years Are Often the Wrong Time

    Converting during a peak earning year can be expensive because the conversion sits on top of salary, bonuses, business profits, and other taxable income. A household already near the top of a federal bracket could push much of a conversion into the 32%, 35%, or 37% brackets, before accounting for state income tax.

    Suppose a couple’s wages and investment income already use all available space in their preferred bracket. Adding a $100,000 conversion does not receive a special Roth tax rate. The additional taxable income is taxed under the same ordinary-income schedule and may spill into higher brackets.

    This does not mean people with large retirement balances should ignore Roth conversions. It means they should compare the tax rate on a conversion today with the projected rate on future withdrawals. A $1 million traditional IRA balance alone does not establish that a conversion is beneficial. The analysis also needs projected withdrawals, portfolio growth, pension income, Social Security, future filing status, and required minimum distributions.

    High earners may find a better opportunity after their wages stop. The period after retirement but before Social Security and required minimum distributions begin can create several lower-income years in which conversions are easier to control.

    When converting at a high current rate might still make sense

    Peak earning years are not automatically off-limits. A conversion at a high rate may still be reasonable when:

    • Future required minimum distributions are projected to be unusually large.
    • The household expects future marginal tax rates to be even higher.
    • A surviving spouse may later file as single while receiving similar investment and retirement income.
    • The owner wants to reduce lifetime required distributions or create more tax flexibility.
    • Estate-planning goals favor leaving Roth assets to beneficiaries.
    • A market decline allows the owner to convert more shares at a temporarily lower account value.

    These exceptions require modeling. Future tax laws, investment returns, spending needs, and life expectancy cannot be predicted with certainty.

    Best Tax-Year Windows for a Roth Conversion

    Early retirement before other income begins

    One of the most useful windows may occur after employment income ends but before Social Security, pensions, and required minimum distributions begin. During these “income trough” years, a retiree may be able to choose how much taxable income to generate.

    Required minimum distributions generally begin at age 73 for people born from 1951 through 1959 and at age 75 for those born in 1960 or later under current federal law. Individual circumstances and future law changes should be confirmed before relying on those ages.

    A job transition or temporary leave

    A layoff, job change, sabbatical, or unpaid leave can produce an unusually low-income calendar year. Before converting, estimate final wages, severance, unemployment compensation, equity compensation, and any year-end bonus. A job starting late in the same year can quickly consume expected bracket room.

    A temporary business downturn

    Business owners with fluctuating income may find conversion opportunities during a low-profit or loss year. However, business income estimates can change after bookkeeping adjustments, depreciation decisions, and late customer payments. Conservative estimates can reduce the risk of an unexpectedly large tax bill.

    A year with substantial deductions or losses

    Large charitable deductions, deductible medical expenses, business losses, or other allowable deductions may reduce taxable income and create conversion capacity. Investment losses require closer analysis: capital losses generally offset capital gains and then only a limited amount of ordinary income each year, with unused losses carried forward.

    Early career years

    A young professional who expects substantial income growth may benefit from converting while in a relatively low bracket. The potential advantage is strongest when the current rate is low, the funds can remain invested for many years, and the conversion tax can be paid without draining the retirement account.

    After moving to a lower-tax state

    Moving from a high-tax state to a state with no individual income tax may reduce the state cost of a conversion. Complete the residency analysis first. States apply different domicile, statutory residency, and income-sourcing rules, and maintaining substantial ties to a former state can complicate the outcome.

    How to Fill Lower Federal Tax Brackets

    A common strategy is to convert only enough to reach the top of a selected federal bracket. This is called “filling the bracket.” It provides a starting point, not a final answer, because other income-based costs may create effective tax rates higher than the published bracket rate.

    Step 1: Estimate taxable income before the conversion

    Include expected wages, business income, taxable interest, dividends, capital gains, pension payments, retirement-account distributions, and the taxable portion of Social Security. Then account for above-the-line adjustments and either the standard deduction or expected itemized deductions.

    Do not confuse adjusted gross income with taxable income. Federal brackets apply to taxable income, while Medicare and Affordable Care Act calculations generally use versions of modified adjusted gross income.

    Step 2: Select a target bracket

    Choose the highest marginal rate the household is willing to pay based on projected future rates. Some households may target the top of the 12% bracket; others may deliberately fill the 22% or 24% bracket to reduce large future required distributions.

    Step 3: Calculate preliminary conversion room

    Subtract estimated taxable income before the conversion from the upper limit of the target bracket.

    For an illustrative historical example, assume a married couple filing jointly had $140,000 of taxable income in 2024. The 22% bracket ended at $201,050 for that filing status:

    $201,050 − $140,000 = $61,050 of preliminary conversion room

    A conversion of approximately $61,050 would bring taxable income to the top of that bracket, assuming the original estimate was accurate and the conversion did not trigger other tax interactions. This is a 2024 illustration, not a current threshold. Tax brackets are indexed and can change, so use official IRS figures for the actual conversion year.

    Step 4: Model partial conversions over several years

    Converting $300,000 in one year can place part of the transaction in a much higher bracket. Converting $60,000 annually over five suitable years may produce a lower cumulative tax cost, although investment growth, future law changes, and available conversion years can alter that conclusion.

    Test at least three amounts: a conservative conversion, an amount that fills the preferred bracket, and a larger conversion that enters the next bracket. Compare lifetime taxes rather than selecting an amount solely because it fits under one threshold.

    Costs and Rules That Can Change the Answer

    Federal and state taxes

    The conversion can increase both federal and state income taxes. It may also require quarterly estimated-tax payments or additional withholding to avoid an underpayment penalty. Withholding tax directly from converted funds leaves less money in the Roth. If the owner is younger than 59½, the withheld portion may also be treated as an early distribution subject to an additional tax unless an exception applies.

    Medicare IRMAA surcharges

    A conversion raises modified adjusted gross income and may increase Medicare Part B and Part D premiums through the income-related monthly adjustment amount, or IRMAA. Medicare generally uses tax-return information from two years earlier, so a conversion may affect premiums two years later.

    IRMAA uses income tiers. Crossing a threshold by a small amount can increase premiums for the applicable year, making the effective cost of the final conversion dollars higher than the federal bracket suggests.

    Affordable Care Act subsidies

    For households using a Marketplace health plan before Medicare eligibility, a conversion may reduce premium tax credits by increasing modified adjusted gross income. Model the subsidy effect before converting; healthcare costs can outweigh the apparent benefit of filling a federal bracket.

    The IRA pro-rata rule

    If you hold both pre-tax and after-tax IRA money, you generally cannot choose to convert only the after-tax dollars. The pro-rata calculation aggregates traditional, SEP, and SIMPLE IRA balances and determines the taxable percentage using year-end values.

    Accurate Form 8606 records are important for documenting nondeductible contributions. Roth IRAs and many employer-sponsored plans are not included in the IRA aggregation calculation, but plan eligibility and rollover options should be reviewed before moving money.

    Roth five-year rules

    Each conversion has a separate five-year period for determining whether an early distribution of converted taxable amounts may face the 10% additional tax when the owner is under 59½. A separate five-year rule helps determine whether Roth IRA earnings are part of a qualified distribution. Age, disability, death, first-home provisions, and withdrawal ordering rules can affect the result.

    Inherited Roth IRAs follow different distribution rules. Many non-spouse beneficiaries must empty the account within 10 years, although qualified withdrawals may be tax-free. Spouses, eligible designated beneficiaries, and accounts that have not satisfied the Roth qualification period can require different treatment.

    A Practical Roth Conversion Worksheet

    1. Project adjusted gross income.
      List wages, self-employment income, interest, dividends, gains, pensions, taxable Social Security, and planned retirement distributions.
    2. Estimate deductions and taxable income.
      Use the expected filing status and the larger of projected itemized deductions or the applicable standard deduction.
    3. Set a maximum acceptable marginal rate.
      Decide whether the household plan supports converting through the 12%, 22%, or 24% bracket—or another selected rate.
    4. Calculate bracket room.
      Subtract projected taxable income from the top of the target bracket using current IRS thresholds.
    5. Test several conversion amounts.
      Model smaller and larger amounts instead of assuming the bracket ceiling is automatically optimal.
    6. Add indirect costs.
      Include state tax, IRMAA, reduced ACA subsidies, credit phaseouts, and estimated-payment requirements.
    7. Compare future scenarios.
      Estimate taxes with and without conversions, including future withdrawals and required minimum distributions.
    8. Document assumptions.
      Record expected retirement age, Social Security timing, pension start date, portfolio growth, inflation, spending, filing status, and tax-law assumptions.

    The worksheet should be updated whenever an assumption changes. A conversion that looks attractive under an 8% growth projection may be less compelling with slower growth or a shorter holding period. Conversely, strong growth in a large traditional IRA may increase projected required distributions and strengthen the case for earlier partial conversions.

    What to Do Next

    Start by building a three-to-five-year income forecast. Mark years when wages may fall, deductions may rise, or Social Security and required minimum distributions have not yet begun. Those are the years most likely to contain a Roth conversion sweet spot.

    Before initiating a transfer:

    • Run federal and state income-tax projections.
    • Check IRMAA exposure for the relevant future Medicare premium year.
    • Estimate the effect on Affordable Care Act premium tax credits.
    • Confirm any after-tax IRA basis and apply the pro-rata rule.
    • Verify the custodian’s processing deadline and transaction instructions.
    • Plan for estimated taxes or withholding without unnecessarily reducing the converted balance.

    When possible, paying the tax from taxable cash allows the entire converted amount to remain invested in the Roth. That approach is not appropriate if it would deplete emergency savings or require selling investments with substantial tax consequences.

    Coordinate the final decision with a qualified tax professional or financial planner who can evaluate the entire household tax return. Revisit the plan each fall, when annual income is easier to estimate but there is still time to complete the transaction. Income, deductions, investment values, healthcare costs, and tax thresholds change, so the ideal conversion amount should be recalculated every year.

    The central question remains straightforward: Is the all-in tax cost of converting today reasonably lower than the expected cost of withdrawing the same dollars later? Finding a low-income year—and converting only the amount that fits the broader plan—can make the difference between a strategic Roth conversion and an unnecessarily expensive tax bill.

  • 2026 SECURE 2.0: Maximize 401(k) Catch-Up Contributions

    2026 SECURE 2.0: Maximize 401(k) Catch-Up Contributions

    SECURE 2.0 Retirement Law Changes in 2026: Maximize Catch-Up Contributions and Increase 401(k) Savings

    Workers approaching retirement have more room to save in 2026, but higher limits do not increase a 401(k) balance automatically. Employees must update their payroll elections, understand the new Roth catch-up requirement for higher earners, and avoid contribution timing mistakes that could reduce an employer match.

    The key numbers are now confirmed by the IRS: most employees may defer $24,500 into a 401(k) in 2026. Workers age 50 or older can contribute an additional $8,000, while eligible employees ages 60 through 63 can use an enhanced $11,250 catch-up limit. These limits create a valuable opportunity to increase retirement savings during what may be a worker’s highest-earning years.

    2026 SECURE 2.0 401(k) Changes at a Glance

    The regular employee elective-deferral limit rises from $23,500 in 2025 to $24,500 in 2026. This limit generally applies across an employee’s combined pretax and Roth contributions to 401(k), 403(b), and certain other workplace plans.

    2026 limit Amount Maximum employee contribution
    Regular employee deferral $24,500 $24,500 for workers under age 50
    Standard catch-up $8,000 $32,500 for most eligible workers age 50 or older
    Enhanced catch-up for ages 60–63 $11,250 $35,750 for eligible workers ages 60 through 63
    Overall defined-contribution plan limit $72,000 Includes regular employee, employer, and certain other contributions, but excludes catch-up contributions

    The $72,000 overall limit includes regular employee deferrals, employer matches, employer nonelective contributions, profit-sharing contributions, and allocations of forfeitures. Catch-up contributions sit above that limit. As a result, the potential overall total is generally $80,000 when an $8,000 catch-up applies or $83,250 when the $11,250 enhanced catch-up applies, subject to compensation and plan restrictions.

    These figures are published in IRS Notice 2025-67 and summarized on the IRS page covering 401(k) and profit-sharing plan contribution limits. Employees should still confirm the limits and contribution procedures shown in their employer’s 2026 plan materials.

    Who Qualifies for 2026 Catch-Up Contributions?

    A participant generally becomes eligible for an age-50 catch-up contribution in the calendar year the participant turns 50. Someone who turns 50 in December 2026 can therefore qualify for the entire 2026 catch-up limit; the amount is not prorated based on the birthday.

    Eligibility alone does not guarantee access. The employer’s plan must permit catch-up contributions, and its payroll system must be able to process them. A plan may also impose operational limits, such as a maximum percentage of compensation that can be deferred from each paycheck.

    Standard catch-up versus enhanced catch-up

    Most eligible participants age 50 or older can contribute an additional $8,000 in 2026, for a maximum employee deferral of $32,500. SECURE 2.0 provides a larger catch-up for participants who attain ages 60, 61, 62, or 63 during the calendar year.

    • Ages 50–59: $8,000 catch-up; $32,500 maximum employee contribution.
    • Ages 60–63: $11,250 enhanced catch-up; $35,750 maximum employee contribution.
    • Age 64 and older: The standard $8,000 catch-up generally applies again.

    The enhanced limit depends on age during the contribution year, not the participant’s age when the contribution election is submitted. For example, an employee who turns 60 at any point in 2026 can generally qualify for the $11,250 limit for that year if the plan supports catch-up contributions.

    The 2026 Roth Catch-Up Rule for Higher Earners

    SECURE 2.0 changes the tax treatment of catch-up contributions for certain higher-paid employees. For 2026, an employee whose applicable 2025 FICA wages from the employer sponsoring the plan exceeded $150,000 generally must make 2026 catch-up contributions as designated Roth contributions.

    The law established a $145,000 threshold and required it to be indexed. The IRS increased the threshold used for 2026 catch-up contributions to $150,000. The test is based on the preceding year’s wages from the employer sponsoring the plan—not household income, adjusted gross income, investment income, or the employee’s expected 2026 salary.

    • If applicable 2025 wages from the employer were $148,000, the federal Roth catch-up mandate generally does not apply for 2026.
    • If applicable 2025 wages were exactly $150,000, the statutory test uses “exceeded,” so the mandate generally does not apply.
    • If applicable 2025 wages were $150,001, 2026 catch-up contributions generally must be Roth.

    Bonuses and other compensation subject to FICA taxes may affect the wage calculation. Employees who changed employers, work for related businesses, or received unusual compensation should ask the plan administrator which wages were used. The final regulations also address situations involving certain related employers and payroll corrections.

    What changes in payroll?

    Affected employees may still direct the first $24,500 of 2026 elective deferrals to a traditional, Roth, or permitted combination of accounts. However, amounts treated as catch-up contributions generally must go into the plan’s Roth account.

    Roth contributions are included in current taxable income. They do not provide the immediate federal income-tax reduction associated with traditional pretax deferrals. In exchange, investment earnings and withdrawals can be federally tax-free when the distribution is qualified, generally requiring satisfaction of the Roth five-taxable-year rule and an eligible distribution event such as reaching age 59½.

    The statutory Roth requirement applies in 2026, although the Treasury Department’s final catch-up regulations generally apply beginning in 2027. Plans may rely on a reasonable, good-faith interpretation for 2026. Employees should confirm whether their plan will automatically convert affected catch-up amounts to Roth, require a separate election, or restrict catch-up contributions if no Roth feature is available.

    Roth Versus Traditional Catch-Up Contributions

    Workers who are not subject to the mandatory Roth rule may have a choice between traditional and Roth catch-up contributions, assuming the plan offers both.

    Feature Traditional 401(k) Roth 401(k)
    Tax treatment when contributed Generally reduces current federal taxable income Made after income tax
    Tax treatment when withdrawn Generally taxable as ordinary income Qualified withdrawals are generally federally tax-free
    Income phaseout No income phaseout for plan eligibility No Roth IRA-style income phaseout
    Immediate effect on take-home pay Usually smaller because of the current tax benefit Usually larger because the contribution is after tax

    Traditional contributions may be attractive to someone in a relatively high current tax bracket who expects a lower taxable income in retirement. Roth contributions may be useful for someone expecting higher future tax rates, wanting more tax diversification, or having substantial pretax retirement assets already.

    Cash flow matters as well. Contributing $8,000 to a Roth 401(k) can reduce take-home pay more than contributing $8,000 pretax because the employee must also fund the associated current income tax.

    Unlike a Roth IRA, a Roth 401(k) does not impose an income phaseout on contributions. Roth workplace accounts also no longer require lifetime required minimum distributions for the original account owner under current federal rules. Beneficiary, rollover, five-year, state-tax, and withdrawal rules still require attention, particularly before moving or distributing money.

    A Practical Plan to Maximize 401(k) Savings in 2026

    1. Calculate the required contribution rate

    Start with the amount still needed and divide it by the eligible compensation remaining in the year:

    Required deferral percentage = Remaining contribution goal ÷ Remaining eligible gross pay

    To contribute $24,500 evenly over a full year, the payroll amounts would be approximately:

    • $2,041.67 per month over 12 monthly paychecks.
    • $1,020.83 per paycheck over 24 semimonthly paychecks.
    • $942.31 per paycheck over 26 biweekly paychecks.

    An employee earning $120,000 evenly throughout the year would need to defer about 20.42% of pay to reach the regular $24,500 limit. To reach the $32,500 limit with the standard catch-up, the rate rises to approximately 27.08%.

    2. Activate catch-up processing

    Some payroll systems automatically classify contributions above the regular limit as catch-up contributions. Others require a separate catch-up election. Set the regular contribution rate and, where available, enable an automatic catch-up election so contributions continue after the first $24,500 is reached.

    3. Capture the full employer match

    Contribute at least enough to receive the entire employer match before prioritizing unmatched retirement accounts. Review the plan’s definition of eligible compensation because bonuses, commissions, and other pay may be treated differently.

    4. Check the true-up policy before front-loading

    Front-loading means contributing heavily early in the year. This can put money to work sooner, but it may cost an employee part of the employer match if the plan calculates matching contributions paycheck by paycheck and does not provide a year-end true-up.

    For example, suppose a company matches 100% of the first 5% contributed each paycheck. An employee who reaches the annual limit in September and contributes nothing from October through December could miss matches on those later paychecks unless the plan performs a true-up.

    5. Coordinate with other financial priorities

    Maximizing a 401(k) should not leave a household unable to cover near-term expenses. Consider the contribution rate alongside:

    • An emergency fund for essential expenses.
    • High-interest debt repayment.
    • Health savings account contributions for eligible employees.
    • Traditional or Roth IRA eligibility and limits.
    • Upcoming taxes, insurance premiums, and major purchases.

    Worked Examples for Different Ages and Incomes

    Example 1: A 55-year-old earning $120,000

    Assume the employee also had $120,000 of applicable wages from the same employer in 2025, receives 26 biweekly paychecks, chooses traditional pretax contributions, and has a dollar-for-dollar employer match on the first 5% of pay.

    • Regular 2026 deferral: $24,500.
    • Standard age-50 catch-up: $8,000.
    • Total employee contribution: $32,500.
    • Monthly equivalent: approximately $2,708.33.
    • Biweekly contribution: $1,250.
    • Required savings rate: approximately 27.08% of gross pay.
    • Assumed employer match: $6,000.
    • Total employee-plus-employer contribution: $38,500.

    Because the assumed 2025 wages did not exceed $150,000, the employee is not federally required to make the catch-up as Roth. The plan may permit traditional, Roth, or a combination.

    Example 2: A 62-year-old earning $180,000

    Assume the employee also received $180,000 of applicable 2025 wages from the same employer, qualifies for the enhanced catch-up, and receives an employer match equal to 100% of the first 4% of pay.

    • Regular 2026 deferral: $24,500.
    • Enhanced age-60-to-63 catch-up: $11,250.
    • Total employee contribution: $35,750.
    • Monthly equivalent: approximately $2,979.17.
    • Biweekly equivalent: $1,375.
    • Required savings rate: approximately 19.86% of gross pay.
    • Assumed employer match: $7,200.
    • Total employee-plus-employer contribution: $42,950.

    The employee’s 2025 wages exceeded the $150,000 threshold, so the $11,250 catch-up generally must be Roth. The first $24,500 could remain traditional if the employee elects that treatment and the plan allows it.

    How the Roth rule may affect take-home pay

    Assume, solely for illustration, that the employee’s marginal federal income-tax rate is 24%. Requiring an $11,250 catch-up to be Roth instead of traditional removes an estimated $2,700 of current federal income-tax savings:

    $11,250 × 24% = $2,700 per year, or about $225 per month

    The actual payroll impact depends on filing status, deductions, other income, state taxes, withholding elections, and the timing of contributions. Traditional and Roth 401(k) contributions are also generally treated the same for Social Security and Medicare tax purposes.

    2026 Checklist: Avoid Missed Contributions and Payroll Errors

    • Confirm the plan’s $24,500 regular limit and the catch-up limit applicable to your age.
    • Verify that the plan permits catch-up contributions and offers a designated Roth account.
    • Ask whether catch-up contributions require a separate payroll election.
    • Review the employer match formula and year-end true-up policy.
    • Confirm whether bonuses, commissions, and other compensation are eligible for deferrals and matching contributions.
    • Check the applicable 2025 FICA wages used for the $150,000 Roth catch-up test.
    • Update elections early enough to spread the remaining contribution goal across available pay periods.
    • Monitor year-to-date traditional and Roth contributions on each pay statement.
    • Coordinate deferrals if you participate in plans maintained by more than one employer.
    • Review current IRS guidance and your plan’s notices before making year-end adjustments.

    What to Do Next

    Download your employer’s 2026 plan summary, locate your final 2025 pay statement or Form W-2, and calculate the amount needed per remaining paycheck. Then confirm the Roth catch-up procedure, employer-match true-up policy, and payroll deadline before changing your election.

    SECURE 2.0 gives older workers more room to save, but the benefit depends on accurate payroll setup and a contribution rate that fits the household budget. This article is educational and does not provide personalized tax, legal, investment, or financial advice. Consider reviewing contribution choices and distribution rules with a qualified tax professional or financial adviser.

  • MacKenzie Scott Net Worth 2026: Fortune, Divorce & Giving

    MacKenzie Scott Net Worth 2026: Fortune, Divorce & Giving

    MacKenzie Scott Estimated Net Worth 2026: Amazon Divorce Settlement, Philanthropy Strategy, and Her $45B Fortune

    MacKenzie Scott’s estimated net worth in 2026 depends heavily on the valuation date and the assumptions used. Published figures have ranged from the mid-$30 billions to approximately $40 billion or more, while a more recent Forbes estimate placed her wealth lower.

    As of September 11, 2026, Forbes estimated Scott’s real-time net worth at $27.5 billion. Bloomberg had valued her at approximately $36.5 billion on May 18, 2026, while estimates around $40 billion to $45 billion appeared during stronger Amazon share prices and before some of her latest gifts were reflected.

    The practical conclusion is that the frequently cited “$45 billion fortune” is best treated as an upper-end or dated estimate—not a verified cash balance. Scott does not publish a complete personal balance sheet, and outside estimates must model her Amazon ownership, stock transfers, taxes, investment returns, cash and charitable distributions.

    MacKenzie Scott Estimated Net Worth 2026: The Short Answer

    A reasonable market-sensitive range for MacKenzie Scott’s estimated net worth during 2026 is approximately $28 billion to $40 billion. Estimates approaching $45 billion may be defensible for particular valuation dates or more generous portfolio assumptions, but they should not be presented as a fixed current figure.

    Estimate or reference point Valuation date Reported amount
    Forbes real-time estimate September 11, 2026 $27.5 billion
    Bloomberg Billionaires Index May 18, 2026 $36.5 billion
    Forbes estimate cited by Inc. November 17, 2025 About $34 billion
    Bloomberg estimate cited by Higher Ed Dive November 2025 About $42 billion
    Common upper-end estimates 2025–2026, depending on source Approximately $40–$45 billion

    Several variables explain the wide range:

    • Amazon’s share price: Scott’s remaining Amazon position can rise or fall by billions of dollars as the stock moves.
    • Charitable giving: Assets cease to be part of her personal net worth once they are irrevocably donated.
    • Stock sales and transfers: Public disclosures do not always reveal whether shares became cash, diversified investments or charitable contributions.
    • Taxes: Taxes on taxable stock sales reduce the amount available to reinvest, but her complete tax position is private.
    • Portfolio assumptions: Bloomberg, Forbes and other publishers use different methods to estimate cash, investment returns and unreported assets.

    Confidence in any precise figure is therefore limited. The reliable conclusion is that Amazon remains the original source of Scott’s wealth, while the exact composition of her current portfolio is not publicly known.

    How MacKenzie Scott Built Her Fortune Before Amazon

    Scott’s wealth did not come from a conventional executive salary or a later investment in Amazon. It came from her economic interest in the company built during her marriage to Jeff Bezos and from her involvement during Amazon’s earliest years.

    D.E. Shaw, marriage and the move to Seattle

    After graduating from Princeton University in 1992, Scott joined the New York investment firm D.E. Shaw as a research associate. She met Bezos there, and the two married in 1993.

    In 1994, they moved to the Seattle area as Bezos prepared to start an internet-based bookstore. Amazon was founded that year and began selling books online in 1995.

    Her work during Amazon’s early days

    Scott participated in the startup’s formative operations. Accounts of Amazon’s early history credit her with keeping the books, writing checks, handling accounting work and helping negotiate the company’s first freight contract.

    These contributions should not be confused with holding a later corporate leadership role. Scott did not accumulate her fortune through years of disclosed Amazon executive compensation. Her wealth arose from the couple’s ownership of Amazon as the company grew from a small online bookseller into a global technology and retail business.

    Her career as a novelist

    Scott also pursued a separate literary career. Her first novel, The Testing of Luther Albright, was published in 2005 and won a 2006 American Book Award. Her second novel, Traps, followed in 2013.

    Book royalties may have generated income, but there is no public evidence that they represent a material portion of her multibillion-dollar fortune. Amazon equity is the dominant wealth driver.

    The 2019 Amazon Divorce Settlement Explained

    Scott and Bezos announced their divorce in January 2019 after 25 years of marriage. In April, Scott publicly described the agreed division of their major business interests.

    Scott received approximately 4% of Amazon

    Under the settlement, Scott received approximately 25% of the couple’s Amazon stock. That represented roughly 4% of the entire company at the time.

    Reports valued the stake at approximately $36 billion to more than $38 billion when the settlement was finalized. Figures near $45 billion generally reflect a different Amazon share price, a later valuation date or a rounded estimate of the settlement’s economic value.

    The settlement was primarily an equity transfer—not a reported $36 billion or $45 billion cash payment. That distinction matters because stock-market wealth can change substantially before shares are sold.

    Bezos retained most of the stock and voting control

    Bezos retained 75% of the couple’s Amazon holdings. Scott also granted him voting control over the shares she received, even though she retained their economic ownership.

    In practical terms, Scott benefited when her shares appreciated and bore the loss when they declined, but Bezos could vote the shares under the arrangement. Scott also relinquished her interests in The Washington Post and the space company Blue Origin.

    This structure explains why estimates of Scott’s wealth have historically tracked Amazon’s share price much more closely than the value of private assets associated with Bezos.

    What Assets Drive MacKenzie Scott’s Net Worth in 2026?

    Approximately 68 million reported Amazon shares

    The Bloomberg Billionaires Index based its May 2026 calculation on approximately 68 million Amazon shares over which Bezos had proxy voting power. Bloomberg treated those shares as belonging economically to Scott.

    This figure should be described as a reported estimate rather than an independently published inventory from Scott. It comes from analyzing Amazon disclosures and the continuing proxy arrangement.

    How Amazon’s price changes her paper wealth

    The arithmetic illustrates why her estimated net worth moves so quickly. If Scott owns approximately 68 million Amazon shares:

    • A $1 movement in Amazon stock changes the position’s value by about $68 million.
    • A $10 movement changes it by about $680 million.
    • A $25 movement changes it by approximately $1.7 billion.

    These are changes in estimated market value, not necessarily realized profits or losses. Scott would need to sell shares to convert that value into cash, and a large sale could create tax consequences.

    Cash and other investments are less visible

    Amazon shares alone do not explain every published estimate. Scott may also hold cash, securities purchased with stock-sale proceeds and other investments. Income or dividends from a diversified portfolio may add to her wealth, although the assets and amounts are not publicly itemized.

    Bloomberg says its cash calculation adjusts for estimated dividends, insider transactions, taxes and market performance. Those adjustments are models, not disclosures from Scott. Forbes uses its own valuation process, which helps explain why the two publishers can arrive at different results on similar dates.

    Readers should distinguish among three categories:

    • Reported holdings: Shares or transactions identifiable through corporate and regulatory disclosures.
    • Modeled assets: Estimated cash and investment proceeds calculated by wealth-tracking publications.
    • Unknown assets and liabilities: Private investments, taxes, expenses or commitments that have not been disclosed.

    MacKenzie Scott Net Worth Timeline: 2019 to 2026

    2019: The divorce settlement creates a $36 billion-plus fortune

    Scott’s 4% Amazon stake was initially valued at roughly $36 billion to $38 billion. Because the asset was publicly traded, its value could be estimated more readily than a private-company stake, although it was still market-sensitive.

    2021: Amazon’s pandemic-era rise pushes estimates near $53 billion

    Amazon shares climbed during the pandemic as online shopping and cloud-computing demand increased. Forbes estimates cited by Inc. placed Scott’s wealth around $53 billion in 2021, even after she had begun making multibillion-dollar gifts.

    2023–2025: Donations and portfolio changes reshape the estimate

    Scott announced approximately $2.1 billion in gifts during 2023 and $2.6 billion in 2024. Her giving accelerated sharply in 2025, when she disclosed approximately $7.1 billion in donations.

    Over this period, Amazon’s price fluctuated and her disclosed or inferred share count declined. Published net-worth estimates consequently moved in both directions. Inc. cited a Forbes estimate of about $34 billion as of November 17, 2025, while Bloomberg was reported at approximately $42 billion earlier that month.

    2026: The valuation date matters

    Bloomberg estimated Scott’s wealth at $36.5 billion on May 18, 2026. Its methodology valued public shares using recent market prices and modeled her cash based on known transactions, taxes and investment performance.

    Forbes subsequently reported a real-time estimate of $27.5 billion on September 11, 2026. Because it is the more recent dated figure, it is the strongest reference point for a “current” estimate, but it remains an outside calculation rather than a disclosed balance sheet.

    For that reason, an article referring to a $45 billion fortune should explain that $45 billion represents an upper-end historical or methodology-dependent valuation—not a definitive September 2026 total.

    MacKenzie Scott’s Philanthropy Strategy and Giving Pace

    The Giving Pledge

    Scott signed the Giving Pledge in May 2019, publicly committing to donate the majority of her wealth. The pledge is a moral and public commitment, not a legally binding contract that dictates when, where or how the money must be distributed.

    Scott’s pace distinguishes her from donors who plan to complete most of their giving through estates or foundations over several decades. She has transferred billions of dollars while remaining one of the world’s wealthiest individuals.

    Yield Giving and unrestricted grants

    Yield Giving reports that Scott’s network has distributed more than $26 billion through over 2,700 gifts. The organization’s name reflects its central idea: increasing value by giving up control.

    Many grants are unrestricted. Recipient organizations can decide whether to use the money for staffing, facilities, reserves, technology, endowments or program expansion. This recipient-led model contrasts with grants that restrict spending to a narrow project and require extensive reporting.

    Her giving has supported areas including:

    • Racial equity and community development
    • Child development and youth services
    • Food security, housing and economic mobility
    • Higher education and college access
    • Historically Black colleges and universities
    • Tribal and Indigenous colleges and scholarship organizations
    • Hispanic-serving institutions
    • Public health and nonprofit capacity building

    Case study: $387 million for eight HBCUs

    One widely reported 2025 giving wave directed $387 million to eight HBCUs. The gifts were announced from mid-October through early November rather than as one payment on a single day.

    The recipients included Howard University, Morgan State University, Virginia State University, Alcorn State University, Spelman College, Clark Atlanta University, Alabama State University and the University of Maryland Eastern Shore. Individual gifts ranged from $38 million to $80 million, and most were unrestricted.

    The case demonstrates Scott’s approach in practice: select established institutions, provide unusually large grants and leave operating decisions largely to their leaders. It also shows why annual donation totals and net-worth calculations can change by billions within a short period.

    Why MacKenzie Scott Net Worth Estimates Conflict

    Real-time billionaire rankings are snapshots, not audited financial statements. A service may multiply an estimated Amazon share count by the latest closing price, then add modeled cash and investments. Another publisher may use an older ownership filing, different tax assumptions or a different estimate for assets already donated.

    Charitable gifts generally reduce Scott’s personal wealth once ownership of the assets has been transferred. Amazon appreciation can offset part or all of that decline. As a result, she can give away billions during a period when her estimated net worth stays flat—or even increases.

    Some facts are reasonably well supported:

    • Scott received approximately 4% of Amazon in the 2019 divorce settlement.
    • Bezos retained 75% of the couple’s Amazon stock and voting control over Scott’s shares.
    • Scott relinquished interests in The Washington Post and Blue Origin.
    • Yield Giving reports more than $26 billion in over 2,700 gifts.
    • Amazon remains the original and most important source of her fortune.

    Other figures remain estimates, including her exact cash balance, taxable gains, private investments, current liabilities and the destination of every transferred Amazon share.

    The Bottom Line

    MacKenzie Scott remains extraordinarily wealthy, but no single 2026 net-worth number should be treated as permanent. Depending on the date and methodology, major publications have placed her fortune anywhere from the high-$20 billions to more than $40 billion. The $45 billion figure is better understood as an upper-end estimate associated with stronger market conditions, not a verified current balance.

    Her wealth originated in the Amazon stake divided during her 2019 divorce, supported by her involvement in the company’s earliest years. Her financial story since then is unusual because the objective is not simply to maximize or preserve the fortune. Her stated strategy is to distribute it over time through large, frequently unrestricted grants.

    What to Do Next

    Readers evaluating major philanthropy should look beyond billionaire rankings. A better framework is to examine:

    • Whether grant amounts and recipients are publicly documented
    • Whether funds have actually reached operating nonprofits
    • How much discretion recipients have over the money
    • Whether organizations disclose measurable outcomes over time
    • How giving changes institutional capacity, financial stability and community impact

    Net-worth estimates can show the scale of a donor’s resources. Grant transparency and real-world results provide a more useful measure of what those resources accomplish.

  • VOO vs SCHD vs QQQ: Best ETF for 2026?

    VOO vs SCHD vs QQQ: Best ETF for 2026?

    VOO vs SCHD vs QQQ in 2026: Which ETF Fits a Long-Term Buy-and-Hold Portfolio?

    VOO, SCHD, and QQQ are popular U.S. exchange-traded funds, but they serve different purposes. VOO offers broad exposure to large U.S. companies, SCHD emphasizes dividend income and financial quality, and QQQ concentrates more heavily on growth-oriented Nasdaq companies.

    The right choice depends on the job the investment must perform. A beginner may value VOO’s simplicity, an income-focused investor may prefer SCHD’s dividend strategy, and an investor comfortable with greater volatility may use QQQ as a growth tilt. Owning all three can create a more balanced mix, but it also produces substantial overlap and does not create a complete portfolio by itself.

    This article is educational and is not personalized investment, tax, or financial advice. ETF expense ratios, holdings, sector weights, yields, distributions, and performance change over time. Confirm all fund data on the issuer’s website before publication or investing.

    Quick Answer: VOO, SCHD, or QQQ?

    • VOO is the broad U.S. large-cap core. It tracks the S&P 500 and can serve as the primary U.S. stock holding in a simple long-term portfolio.
    • SCHD is the dividend and value-oriented option. It holds approximately 100 established dividend-paying companies selected using dividend history and financial-quality screens.
    • QQQ is the concentrated growth tilt. It follows the Nasdaq-100 and carries substantial exposure to technology, semiconductors, communications, and consumer internet companies.

    For someone choosing only one U.S. equity ETF, VOO is generally the most diversified of these three choices. SCHD may fit investors who prioritize current income or want less reliance on the largest growth companies. QQQ may suit investors with a long time horizon, confidence in growth businesses, and the ability to tolerate sharper declines.

    VOO vs SCHD vs QQQ: At-a-Glance Comparison

    The fund facts below are approximate and should be verified against the latest Vanguard, Schwab, and Invesco materials. The “potential portfolio role” column is editorial interpretation rather than a reported fund characteristic.

    ETF Index Tracked Approximate Holdings Approximate Expense Ratio Dividend Schedule General Sector Profile Potential Portfolio Role
    VOO S&P 500 Index About 500 0.03% Quarterly Broad large-cap exposure, with meaningful technology weight Core U.S. equity holding
    SCHD Dow Jones U.S. Dividend 100 Index About 100 0.06% Quarterly Dividend-oriented exposure with value and quality characteristics Income and dividend-value tilt
    QQQ Nasdaq-100 Index About 100 Approximately 0.20% Quarterly Growth-heavy, with substantial technology and communications exposure Concentrated growth tilt

    Invesco also offers QQQM, which tracks the Nasdaq-100 with a lower expense ratio than QQQ. Long-term investors who do not need QQQ’s exceptionally deep trading volume and options market may find QQQM more cost-efficient. Verify the current fees for both funds because expense ratios can change.

    VOO: The Simplest Core ETF for Long-Term Investors

    VOO owns approximately 500 leading U.S. companies through the S&P 500. Its portfolio spans information technology, financials, healthcare, consumer businesses, industrials, energy, utilities, real estate, and other major sectors.

    The index is weighted by market capitalization. As a company’s market value rises relative to other constituents, its influence on the fund generally increases. This approach automatically gives investors more exposure to successful large companies, but it also means that a relatively small group of mega-cap stocks can drive a significant share of performance.

    Companies such as NVIDIA, Apple, and Microsoft have recently ranked among the index’s most influential holdings, although their order and weights change with market prices and index updates. VOO therefore offers broad exposure, but it is not equally weighted across 500 companies. An investor may own hundreds of stocks while still depending heavily on the largest positions.

    VOO’s Main Strengths

    • Broad large-cap exposure: One purchase provides access to companies across all major U.S. economic sectors.
    • Low cost: An expense ratio of approximately 0.03% equals about $3 annually for every $10,000 invested, excluding trading costs and other expenses.
    • Strong liquidity: VOO is widely traded, making it generally easy to buy and sell during market hours.
    • Simple maintenance: The index periodically removes companies that no longer qualify and adds eligible replacements.

    VOO’s Main Risks

    VOO is a U.S. large-cap fund, not a complete global portfolio. It provides little direct exposure to small companies and no dedicated international allocation. Its market-cap weighting also creates meaningful concentration in the largest corporations.

    During a broad U.S. bear market, VOO can decline substantially. Diversification across 500 companies reduces company-specific risk, but it does not eliminate stock-market risk.

    SCHD: Dividend Income, Quality Screens, and Value Exposure

    SCHD tracks the Dow Jones U.S. Dividend 100 Index. The strategy focuses on established U.S. companies with a record of paying dividends and applies additional measures related to financial strength and dividend quality. It is more selective than a broad market-cap index.

    SCHD’s portfolio can look considerably different from VOO. Depending on the index’s annual reconstitution and market movements, SCHD may have greater exposure to areas such as healthcare, industrials, consumer staples, and energy, while relying less heavily on mega-cap growth stocks.

    The fund normally distributes dividends quarterly. Investors who do not need the cash can reinvest those payments to purchase additional shares. Reinvestment can increase the number of shares owned and allow future distributions to compound, although neither dividend payments nor dividend growth is guaranteed.

    A higher yield should not be confused with a higher expected total return. Total return includes both price changes and distributions. A stock can pay a large dividend while its market value falls, and a lower-yielding company can produce a better overall result through stronger earnings and price growth.

    SCHD’s Main Strengths

    • Income potential: SCHD has generally offered a higher yield than broad growth-heavy U.S. indexes.
    • Quality-focused methodology: Its index does more than select the highest-yielding stocks.
    • Different factor exposure: The strategy typically leans more toward dividend, quality, and value characteristics.
    • Less dependence on mega-cap technology: SCHD can complement portfolios dominated by large growth companies.

    SCHD’s Main Risks

    Companies can reduce or eliminate dividends when earnings deteriorate or management priorities change. SCHD’s sector tilts can also become a disadvantage when its favored industries underperform. The fund may lag during bull markets led by non-dividend-paying or lower-yielding growth companies.

    Investors should also avoid treating SCHD like a bond. Its distributions fluctuate, its share price can fall, and it does not promise repayment of principal on a fixed date.

    QQQ: Higher Growth Potential with Greater Concentration

    QQQ tracks the Nasdaq-100, which includes 100 of the largest non-financial companies listed on the Nasdaq Stock Market. It is often described as a technology fund, but the index is not formally limited to technology. It can also hold large communications, retail, biotechnology, and consumer companies.

    In practice, QQQ has substantial exposure to semiconductors, software, cloud computing, digital advertising, communications platforms, and internet commerce. Common major holdings have included NVIDIA, Apple, Microsoft, Amazon, Meta Platforms, Alphabet, and Broadcom. Exact holdings and weights should be checked before publication because market movements can change them quickly.

    QQQ has benefited during periods when large technology and growth companies led the market. It also provides direct participation in themes such as artificial intelligence, semiconductor demand, cloud infrastructure, and digital services. Those opportunities come with higher concentration risk.

    QQQ’s Main Strengths

    • Targeted growth exposure: QQQ emphasizes businesses associated with technology and long-term innovation trends.
    • Participation in technology-led markets: It has a long record of strong performance when large growth companies outperform.
    • Highly liquid trading: QQQ has deep daily volume and an active options market, which may matter to traders.

    QQQ’s Main Risks

    QQQ is less diversified by sector than VOO. High-growth companies can be especially sensitive to earnings disappointments, elevated valuations, and changes in interest-rate expectations. A technology-led sell-off could therefore produce a sharper decline than investors expect from a fund holding approximately 100 companies.

    QQQ also overlaps substantially with VOO. Buying both does not simply add 100 unrelated businesses to an S&P 500 portfolio. It often increases the weight assigned to companies already among VOO’s largest holdings.

    For buy-and-hold investors seeking comparable Nasdaq-100 exposure, QQQM deserves consideration because of its lower expense ratio. QQQ may remain preferable when trading liquidity or options activity is important.

    How Much Diversification Do You Get by Owning All Three?

    Owning VOO, SCHD, and QQQ can diversify investment styles, but the combination is less diversified than three ticker symbols might suggest.

    VOO and QQQ commonly share several of their largest holdings. Adding QQQ to VOO usually increases exposure to mega-cap growth companies rather than introducing an entirely new collection of assets. If NVIDIA, Apple, Microsoft, or other shared holdings decline, both funds may be affected simultaneously.

    SCHD can provide a more distinct sector and factor profile. Its dividend screens may produce greater exposure to mature healthcare, industrial, consumer staples, telecommunications, or energy companies. However, SCHD remains a U.S. stock fund and can fall alongside the broader equity market.

    To evaluate the true diversification of a three-ETF portfolio, review:

    • The combined weight of the 10 largest companies
    • Overlap among individual holdings
    • Combined technology and communications exposure
    • Exposure to large-, mid-, and small-cap companies
    • The balance between growth, value, and dividend strategies
    • U.S. versus international revenue and stock-market exposure

    None of these funds provides meaningful dedicated exposure to international stocks, bonds, or U.S. small-cap stocks. Investors seeking broader diversification may need separate funds for those asset classes.

    Which ETF Fits Different Long-Term Investor Profiles?

    Beginner Seeking One U.S. Equity Core

    VOO is the primary candidate among these three. It is inexpensive, broadly diversified across large U.S. companies, and easier to understand than combining multiple overlapping strategies. It can serve as a foundation to which international stocks, smaller companies, or bonds are later added.

    Investor Prioritizing Current Income

    SCHD may be the conditional fit for an investor who values quarterly distributions or plans to reinvest dividends. The investor must still accept equity-market volatility and recognize that dividend income is not guaranteed.

    Investor Seeking an Aggressive Growth Tilt

    QQQ—or lower-cost QQQM—may fit an investor with a long horizon, stable finances, and a high tolerance for volatility. It is better treated as a deliberate growth allocation than as a fully diversified portfolio.

    Investor Combining All Three

    An educational illustration might allocate 60% to VOO, 20% to SCHD, and 20% to QQQ or QQQM. In a $10,000 portfolio, that would equal:

    • $6,000 in VOO for the broad large-cap core
    • $2,000 in SCHD for dividend and value exposure
    • $2,000 in QQQ or QQQM for an additional growth tilt

    This is an illustration, not a recommendation. It would remain a 100% U.S. equity portfolio and could experience substantial losses. Someone approaching retirement or preparing to make withdrawals may need bonds, cash reserves, or other lower-volatility assets rather than relying exclusively on stock ETFs.

    What to Do Next Before Choosing

    1. Define the portfolio’s primary job. Decide whether the priority is broad growth, current income, simplicity, or a combination.
    2. Verify current fund data. Review each issuer’s website for the latest expense ratio, holdings, sector weights, yield, distributions, and trailing performance.
    3. Test the downside. Estimate how the portfolio might behave during a technology sell-off, a dividend-sector slump, or a broad U.S. market decline.
    4. Measure overlap. Calculate the combined exposure to major companies held by both VOO and QQQ.
    5. Choose a target allocation. Establish written percentage targets and rebalance on a consistent schedule instead of chasing whichever ETF recently performed best.
    6. Review the account type. Dividend taxes, capital-gains taxes, and withdrawal rules can differ between taxable brokerage accounts, traditional retirement accounts, and Roth accounts.
    7. Protect near-term finances. Consider emergency savings, high-interest debt, upcoming expenses, and the investment time horizon before committing money to stocks.

    Bottom Line

    VOO is the broad U.S. large-cap core, SCHD is the dividend and value tilt, and QQQ is the concentrated growth tilt. VOO is generally the strongest one-fund candidate for an investor seeking simplicity. SCHD can add income and a different factor profile, while QQQ can increase growth exposure at the cost of greater concentration and volatility.

    The most suitable choice is not necessarily the ETF with the best recent return. It is the fund—or combination of funds—whose costs, risks, income characteristics, and diversification match the investor’s time horizon and the specific job assigned to the portfolio.