Live a richer life. Independent financial guidance for smarter decisions.

Advertiser Disclosure

Search results for: “index fund”

  • Asset Location Strategy: Tax-Smart Account Placement

    Asset Location Strategy: Tax-Smart Account Placement


    Asset Location Strategy: Why Your Account Type Matters More Than Your Asset Allocation

    Most investors spend hours debating whether to hold 60% or 70% in stocks. Far fewer ask an equally important question: which account should hold those stocks? That second question is the domain of asset location—and ignoring it is one of the most common and costly mistakes in personal finance.

    Vanguard research published in August 2022 found that a thoughtful asset location strategy adds between 5 and 30 basis points of after-tax return annually, depending on client characteristics. On a $500,000 portfolio, that translates to $2,500–$15,000 per year in additional after-tax value. Over 25–30 years, the compounding effect can add tens of thousands of dollars that a careless location decision permanently forfeits.

    This article explains how asset location works, which account types are involved, where specific assets belong, and the concrete steps to implement the strategy without triggering a costly tax mistake in the process.


    Asset Location vs. Asset Allocation: The Critical Difference

    Asset allocation is what you invest in—the mix of stocks, bonds, REITs, and cash across your entire portfolio. Asset location is where you hold each piece of that mix: a taxable brokerage account, a traditional IRA or 401(k), or a Roth IRA or Roth 401(k).

    Both decisions matter, but most investors treat allocation as the primary lever and ignore location entirely. This is backwards for high earners. A portfolio with a suboptimal allocation held in the right accounts will often outperform, on an after-tax basis, a beautifully constructed allocation held in the wrong ones.

    According to Vanguard’s 2022 research, placing bonds first in traditional IRA accounts, then Roth accounts, then taxable accounts is the optimal strategy for most investors. Investors who implemented this “conventional” location strategy consistently outperformed those using equal-location (spreading assets evenly across all account types) by 5–30 bps annually. That advantage does not require stock-picking skill, market timing, or higher risk tolerance. It requires only deliberate placement.


    The Three Account Types and How Taxes Work

    Before placing assets strategically, you need a clear understanding of how each account type is taxed. There are three primary types—plus one highly underused fourth option.

    Taxable Brokerage Accounts

    In a taxable account, you owe taxes every year on dividends received, interest earned, and capital gains realized when you sell. The top federal rate on short-term capital gains and ordinary income is 37%. Long-term capital gains (assets held over 12 months) are taxed at 0%, 15%, or 20% depending on your income. High-dividend payers and bonds generate the worst drag here because their income is taxed as ordinary income every year, whether you need the cash or not.

    Tax-Deferred Accounts (Traditional IRA, 401(k))

    Contributions are made pre-tax, and the account grows without annual taxes. However, every dollar you withdraw in retirement is taxed as ordinary income—at whatever marginal rate applies at that time, up to 37% federally. Required Minimum Distributions (RMDs) begin at age 73, forcing taxable withdrawals regardless of whether you need the money.

    Tax-Free Accounts (Roth IRA, Roth 401(k))

    Contributions are made with after-tax dollars, but qualified withdrawals in retirement are completely tax-free—including all growth. This makes Roth accounts the most valuable space for high-growth assets, since every dollar of appreciation escapes future taxation entirely. There are no RMDs on Roth IRAs during the original owner’s lifetime.

    HSAs: The Overlooked Fourth Account Type

    Health Savings Accounts (HSAs) are technically triple tax-advantaged: contributions are pre-tax, growth is tax-free, and withdrawals for qualified medical expenses are tax-free. After age 65, non-medical withdrawals are taxed as ordinary income—the same treatment as a traditional IRA. For investors who can pay medical expenses out-of-pocket and allow the HSA to grow, it is the single most tax-efficient account available. In 2025, the HSA contribution limit is $4,300 for individuals and $8,550 for families.


    Where Your Assets Belong: The Placement Strategy

    Each account type has a natural fit with certain asset classes based on how those assets generate returns and how that income is taxed. The goal is to match tax-inefficient assets with tax-sheltered accounts, and tax-efficient assets with taxable accounts.

    Tax-Deferred Accounts (Traditional IRA, 401(k)): Hold Your Most Tax-Inefficient Assets

    • Taxable bonds and bond funds — Interest income is taxed as ordinary income annually in a taxable account. Sheltering bonds in a 401(k) eliminates this drag entirely until withdrawal.
    • REITs — REIT dividends are generally taxed as ordinary income, not at the lower qualified dividend rate. They belong in tax-deferred accounts.
    • High-dividend equity funds — Similar reasoning: dividends taxed as ordinary income each year create significant drag in a taxable account.
    • Actively managed funds — Higher turnover generates more short-term capital gains distributions, which are taxed as ordinary income in taxable accounts.

    Roth Accounts: Hold Your Highest-Growth Assets

    • Small-cap and growth stock funds — High expected long-term appreciation benefits most from a zero-tax environment. Let compounding work without ever triggering a tax bill on the gains.
    • Emerging market equity funds — Higher volatility and return potential make Roth the ideal location if you have a long time horizon.

    Taxable Accounts: Hold Your Most Tax-Efficient Assets

    • Broad-market passive index funds — Low turnover means minimal capital gains distributions. Long-term gains taxed at 0–20% are manageable. Qualified dividends from U.S. equity index funds are taxed at preferential rates.
    • Individual stocks held long-term — No distributions until you sell. If held until death, heirs receive a stepped-up cost basis, effectively eliminating the embedded capital gains for estate planning purposes.
    • Municipal bonds — Interest is federally tax-exempt, making them naturally suited for taxable accounts. Sheltering them in an IRA wastes the tax-exemption.

    Stepped-up basis note: If you hold appreciated assets in a taxable account until death, your heirs inherit them at the market value on the date of death—not your original purchase price. This resets the cost basis and eliminates the capital gains tax on decades of appreciation. This makes taxable accounts the preferred location for assets you intend to pass on, regardless of tax efficiency during your lifetime.


    The Tax Savings Reality: What Dollar Amounts Actually Matter

    Abstract basis points become meaningful when converted to dollars. Here is a concrete example.

    Assume a household in the 32% federal income tax bracket holds $100,000 in a taxable bond fund yielding 4.5% annually. That generates $4,500 in interest income per year, taxed at 32%, for an annual tax bill of $1,440. If those same bonds are held inside a traditional 401(k), no taxes are due on that interest until withdrawal.

    Over 25 years—assuming no change in yield or tax rate—that is approximately $36,000 in deferred taxes, plus the compounded growth on the money that would otherwise have gone to the IRS each year. Even assuming the investor eventually withdraws at a 22% rate in retirement, the net gain from location optimization alone is still substantial.

    For households in the 37% bracket with larger bond positions, the numbers are proportionally larger. A $300,000 bond portfolio yielding 4.5% generates $13,500 in annual interest income. Sheltering that in tax-deferred accounts saves $4,995 per year at the 37% rate. Over 20 years, that is nearly $100,000 in avoided taxes before accounting for any investment growth on those saved dollars.

    The Compound Effect Across Time

    At $1,500 in annual tax savings (a conservative estimate for a mid-tier portfolio), the 25-year total is $37,500 in avoided taxes. If those savings are reinvested at a 7% annual return, the future value exceeds $95,000. That is real money produced not by taking more risk, but by placing existing assets in the right accounts.


    Who Actually Benefits Most From Asset Location

    Asset location is not a strategy for everyone equally. Its value depends on your specific financial profile.

    • High earners ($200,000+ household income): The higher your marginal tax bracket, the more each dollar of tax-inefficient income costs in a taxable account. The savings from sheltering bonds or REITs are most material above the 24% bracket.
    • Investors with $500,000+ in total assets: At smaller portfolio sizes, the absolute dollar savings may not justify the effort or complexity. At $500K and above, the math becomes compelling.
    • Long-term investors (20+ years to retirement): The compounding benefit of annual tax savings is dramatically larger over longer time horizons. A 35-year-old implementing location strategy has 30 years of compounding advantage versus someone who starts at 55.
    • Those with significant taxable accounts: If 90% of your portfolio is already in tax-protected accounts, location optimization moves the needle very little—you can only protect 10% no matter what. The strategy is most valuable when taxable and tax-advantaged accounts are comparable in size.
    • Investors approaching or in retirement: Asset location helps manage the combined tax burden of RMDs, Social Security income, and taxable investment income. Strategic placement can reduce the percentage of Social Security benefits subject to tax and minimize Medicare IRMAA surcharges.

    The Catch: Liquidity, Time Horizon, and RMDs

    Asset location is a long-term strategy with real constraints. Executing it carelessly can cause more harm than good.

    Liquidity Needs Come First

    Never put your emergency fund or near-term spending reserves in a retirement account. Early withdrawals from a traditional IRA or 401(k) before age 59½ trigger a 10% penalty plus ordinary income tax. Always maintain a taxable account with sufficient liquid assets to cover 3–6 months of expenses and any near-term major purchases.

    RMDs Force Withdrawals Whether You Want Them or Not

    Traditional IRA and 401(k) balances are subject to Required Minimum Distributions starting at age 73. RMDs are calculated based on account balance and IRS life expectancy tables. If you accumulate a very large tax-deferred balance, RMDs can push you into a higher tax bracket in retirement than you planned for. Asset location strategy should account for the eventual forced distribution from these accounts—Roth conversions prior to age 73 can reduce this burden.

    Rebalancing Across Accounts Has Tax Costs

    Moving an appreciated asset out of a taxable account to improve location generates a taxable capital gains event immediately. Before selling a long-held position in a taxable account to relocate it, calculate whether the long-term tax savings from better location exceed the immediate capital gains tax triggered by the sale. In many cases, the break-even period is 5–10 years, and the reshuffling only makes sense if you have a long enough time horizon remaining.

    The better approach for most investors is to implement location gradually: direct new contributions and reinvested dividends into the correct accounts over time, rather than triggering a one-time taxable event by selling everything and starting over.


    Common Asset Location Mistakes to Avoid

    • Holding growth stocks in taxable and bonds in a Roth IRA. This is the exact reversal of the optimal strategy. You are wasting the tax-free Roth space on the lowest-growth asset class and paying ordinary income tax annually on bond interest in a taxable account.
    • Optimizing a small taxable allocation while most assets are sheltered. If 90% of your portfolio is in tax-protected accounts, the location of the remaining 10% has minimal impact. Focus your energy proportionally to where it matters.
    • Selling appreciated positions to implement location immediately. Generating a large capital gains tax bill today to save a smaller amount in taxes annually may take a decade or more to break even. Run the numbers first.
    • Ignoring Roth conversions. A Roth IRA produces zero benefit if it sits underfunded. If you have a large traditional IRA and modest Roth balance, strategic conversions during lower-income years (career transitions, early retirement before Social Security begins) can dramatically improve your long-term location efficiency.
    • Holding municipal bonds in a retirement account. Munis are tax-exempt in a taxable account—placing them in an IRA wastes the tax exemption and converts eventual withdrawals into ordinary income. Always hold munis in taxable accounts.
    • Forgetting inherited assets and stepped-up basis. If you plan to leave assets to heirs, keeping appreciated stock in a taxable account and allowing for a stepped-up basis at death can be more tax-efficient than moving it to a Roth to avoid taxes during your lifetime.

    Action Steps: Implement Your Asset Location Strategy

    Asset location does not require a complete portfolio restructuring. The following steps allow you to build toward an optimized location strategy over time without unnecessary tax costs.

    Step 1: Audit Your Current Holdings

    List every asset you own and which account holds it. Include account type (taxable, traditional, Roth), asset class (bond fund, equity index fund, REIT, etc.), and the current balance. This single exercise often reveals obvious mismatches—bonds in a Roth, for instance, or an S&P 500 index fund in a 401(k) when a REIT fund sits in a taxable account.

    Step 2: Classify Each Asset by Tax Efficiency

    Sort your holdings into two buckets:

    • Tax-inefficient: Taxable bonds, bond funds, REITs, high-dividend funds, actively managed funds with high turnover
    • Tax-efficient: Broad equity index funds, growth-oriented ETFs, individual stocks held long-term, municipal bonds

    Step 3: Map Inefficient Assets to Tax-Deferred Accounts First

    If you have bond funds in a taxable account and an equity index fund in your 401(k), consider swapping them—without selling if possible. In many cases you can simply direct future 401(k) contributions into bond funds and future taxable contributions into equity index funds until the allocation rebalances naturally.

    Step 4: Calculate the Tax Cost Before Selling Anything

    If you need to sell appreciated assets in a taxable account to reposition, estimate the capital gains tax owed and divide it by the estimated annual tax savings from better location. That gives you the break-even period. If the break-even is longer than your investment horizon, do not make the trade.

    Step 5: Set an Annual Location Review

    Your tax bracket, account balances, and retirement timeline change over time. Review your location strategy annually alongside your asset allocation rebalancing. A Roth conversion strategy that makes sense at age 55 with low income may not apply at 62 with higher Social Security and pension income.

    Step 6: Consider Professional Help for Larger Portfolios

    If your portfolio exceeds $500,000 across multiple account types, the ROI on a fee-only financial advisor or CPA who specializes in tax planning can be significant. A one-time location optimization review that adds 10–20 basis points of after-tax return on a $750,000 portfolio is worth $750–$1,500 per year, every year—often well in excess of what the advice costs.


    Bottom Line

    Asset allocation determines how much risk and return potential your portfolio carries. Asset location determines how much of that return you actually keep after taxes. Both matter—but for high earners with substantial savings across multiple account types, location optimization is one of the highest-return, zero-additional-risk improvements available.

    The core rules are straightforward: bonds and REITs belong in tax-deferred accounts, growth assets belong in Roth accounts, and passive equity index funds are the best fit for taxable accounts. The difficult part is implementing this gradually without triggering unnecessary tax events, and adjusting the strategy as your income, accounts, and retirement timeline evolve.

    Start with a full audit of what you own and where you hold it. The mismatch you find may surprise you—and correcting it may be the most profitable financial decision you make this year.

    This article is for informational purposes only and does not constitute personalized financial, tax, or legal advice. Consult a qualified tax professional or fiduciary financial advisor before making changes to your investment accounts.

  • Best Stock Trading Apps for Beginners 2026

    Best Stock Trading Apps for Beginners 2026


    Best Stock Trading Apps for Beginners 2026: Commission-Free Brokers Compared on Fees, Features, and Usability

    A decade ago, buying a single share of stock cost $5 to $10 in broker commissions — each way. A round trip on a $500 position could erase 4% of your capital before the market moved at all. Today, every major U.S. retail broker charges $0 for stock and ETF trades. The competition has shifted to account minimums, hidden fees, platform quality, and education — factors that matter far more to beginners than the headline commission rate.

    This guide compares seven of the top commission-free trading apps available in 2026: Robinhood, Fidelity, Charles Schwab, Interactive Brokers (IBKR Lite), E*TRADE, SoFi, and Ally. We break down what each platform actually costs, which features matter for new investors, and which app fits your specific situation.

    Disclaimer: This article is for informational purposes only and does not constitute personalized financial, tax, or legal advice. Fee structures and features are subject to change; verify current terms directly with each broker before opening an account.

    Why Commission-Free Trading Matters for New Investors

    The elimination of per-trade commissions is not just a marketing move — it fundamentally changes how beginners should approach investing. When brokers charged $7 per trade, buying 10 different stocks cost $140 in fees alone. That friction punished diversification and encouraged holding large positions rather than spreading risk.

    With $0 commissions now standard, you can build a diversified portfolio of ETFs incrementally without fee drag. That said, “commission-free” does not mean free. The real cost of ownership for a brokerage account includes:

    • Options contract fees: Most brokers charge $0.65 per contract even when stock trades are free.
    • Account inactivity fees: Some regional brokers charge $25–$50 if your account sits dormant for 12+ months.
    • Wire transfer fees: Outbound wire transfers typically cost $10–$25 even at zero-commission brokers.
    • Instant deposit fees: Robinhood charges $5 per instant deposit; most competitors waive this for standard ACH.
    • Currency conversion: Relevant if trading international stocks; Interactive Brokers and Fidelity apply 2–4 basis points.
    • Regulatory assessments: The SEC charges a small transaction fee on sell orders (approximately $0.0000278 per dollar sold as of 2026). This is minimal but exists at every broker.

    The brokers in this guide charge $0 for stock and ETF trades and $0 account minimums. The differences lie in what they charge beyond that baseline — and what they provide in return.

    Who This Guide Is For

    Not every beginner has the same needs. This comparison is most useful for four investor profiles:

    • Mobile-first investors who want to trade stocks and ETFs from their phones without complex interfaces or account minimums.
    • Buy-and-hold investors focused on retirement accounts (Traditional IRA, Roth IRA) and low-maintenance index fund strategies.
    • Curious active traders who want to explore options, fractional shares, and faster order execution with basic charting.
    • Budget-conscious beginners who prioritize low barriers to entry and want no surprises on their monthly statements.

    Top Commission-Free Stock Trading Apps Compared (2026)

    Below is a snapshot of the leading platforms. Detailed fee and feature breakdowns follow in subsequent sections.

    Platform Stock/ETF Commission Options (per contract) Account Minimum Fractional Shares Best For
    Robinhood $0 $0 $0 Yes Mobile-first beginners
    Fidelity $0 $0.65 $0 Yes Long-term / retirement investors
    Charles Schwab $0 $0.65 $0 Yes Full-service investors of all levels
    IBKR Lite $0 $0.65 $0 Yes Advanced / cost-conscious traders
    E*TRADE $0 $0.65 $0 No Active and options traders
    SoFi $0 N/A $0 Yes Beginners wanting financial planning tools
    Ally $0 $0.50 $0 No Simple, low-fee self-directed accounts

    Robinhood

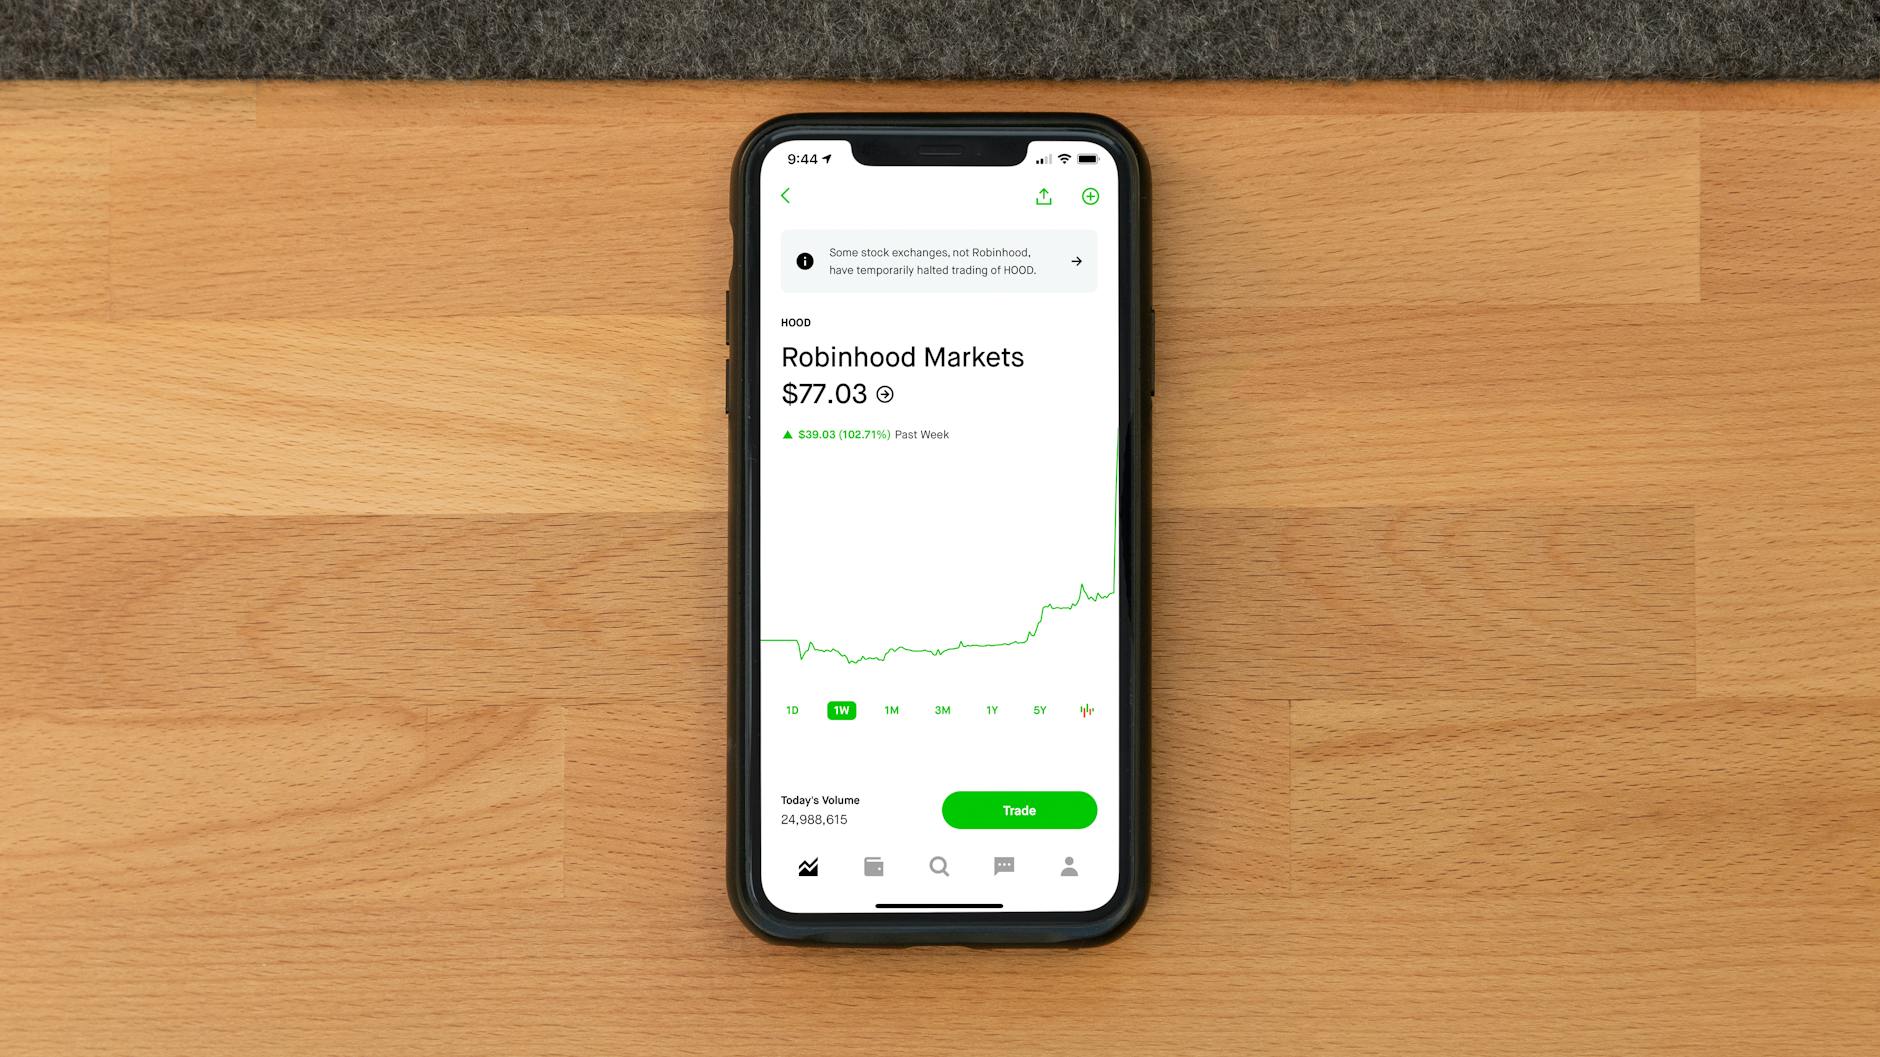
    Robinhood pioneered commission-free trading in 2013 and remains one of the most accessible entry points to the stock market. The mobile app is clean, fast, and requires minimal financial literacy to navigate. You can open an account, link a bank, and place your first trade in under 10 minutes. Robinhood supports stocks, ETFs, options, and cryptocurrency in one app with no account minimum.

    The tradeoffs are real: research tools are limited compared to Fidelity or Schwab, and customer support is primarily in-app rather than via phone. Robinhood also charges $5 per instant deposit, which catches some new users off guard. Use free ACH transfers (3–5 business days) to avoid this fee entirely.

    Fidelity

    Fidelity offers $0 commissions on U.S. stocks, ETFs, and options (options contracts are $0.65 each), plus access to more than 3,400 no-transaction-fee mutual funds. The platform supports Traditional IRA, Roth IRA, Rollover IRA, 529 college savings plans, and Fidelity HSA accounts — a broader account-type menu than most competitors.

    Fidelity Go®, the platform’s robo-advisor, charges 0% annually for balances under $25,000 and 0.35% per year for balances above that threshold. The mobile app mirrors the full web experience. With 100+ physical branches across the U.S., Fidelity is the strongest choice for investors who want both digital tools and the option for in-person guidance.

    Charles Schwab

    Schwab charges $0 commissions on stocks and ETFs and $0.65 per options contract. The platform pulls research from 20+ independent providers — one of the widest third-party research networks among retail brokers. Schwab’s StreetSmart Edge desktop platform caters to active traders, while the standard mobile app is suitable for beginners.

    Schwab also offers human financial advisors and a robo-advisor (Schwab Intelligent Portfolios®), which charges no advisory fee but requires a $5,000 account minimum. Customer support is available 24/7 via phone and chat, which is a meaningful advantage for beginners who hit confusion outside business hours.

    Interactive Brokers (IBKR Lite)

    Interactive Brokers runs two tiers: IBKR Pro (for professional and high-volume traders) and IBKR Lite (for retail investors). IBKR Lite charges $0 commissions on U.S. stocks and ETFs, carries no account minimum, and imposes no annual IRA fees — a meaningful long-term savings compared to some legacy brokers that charged $25–$75 per year to maintain an IRA.

    IBKR Lite also passes along order liquidity rebates, an unusual feature where the broker shares savings when your orders provide liquidity to the market. The platform’s tools are professional-grade — arguably more powerful than a pure beginner needs — but the Lite interface makes the learning curve manageable. Best suited for cost-conscious investors who plan to grow into advanced features.

    E*TRADE

    E*TRADE charges $0 commissions on stocks and ETFs and $0.65 per options contract. The standard mobile app handles everyday trading, while the Power E*TRADE app layer adds advanced charting, options analytics, and a paper trading mode for practicing strategies without real money at risk. That practice-trading feature is particularly valuable for beginners before they commit real capital to options strategies.

    E*TRADE does not currently offer fractional shares, which limits its appeal for beginners who want exposure to high-priced stocks like Amazon or Google without buying a full share.

    SoFi

    SoFi positions itself as a financial services super-app rather than a pure brokerage. The investing arm offers $0 commissions on stocks and ETFs, fractional shares starting at $5, and built-in financial planning tools that connect your investment account to budgeting and loan management features. SoFi does not offer options trading as of 2026.

    Research depth is limited compared to Fidelity and Schwab. SoFi is best for beginners who want a single app to handle investing alongside other financial goals, and who are not yet focused on options or in-depth stock analysis.

    Ally Invest

    Ally charges $0 on U.S. stocks and ETFs, $0.50 per options contract (lower than the industry-standard $0.65), and imposes no account minimum or inactivity fees. As an online-only broker, Ally has no physical branches, but its interface is clean and straightforward. It integrates directly with Ally Bank accounts, making deposits and withdrawals fast for existing Ally banking customers.

    Ally does not offer fractional shares, which limits position-sizing flexibility for accounts under $500.

    Fee Breakdown: What You Actually Pay Beyond Commissions

    All seven platforms charge $0 for stock and ETF trades. Here is where real costs appear:

    Fee Type Robinhood Fidelity Schwab IBKR Lite E*TRADE SoFi Ally
    Options (per contract) $0 $0.65 $0.65 $0.65 $0.65 N/A $0.50
    Account minimum $0 $0 $0 $0 $0 $0 $0
    Inactivity fee $0 $0 $0 $0 $0 $0 $0
    Instant deposit fee $5 $0 $0 $0 $0 $0 $0
    Annual IRA fee $0 $0 $0 $0 $0 $0 $0
    Outbound wire transfer $25 $0 (domestic) $25 $10 $25 $0 $0 (via Ally Bank)

    Practical takeaway: For a beginner who deposits via ACH, holds stocks and ETFs, and never trades options or wires money, the total annual cost is $0 at all seven platforms. Fees only appear when you add complexity — instant deposits, options contracts, or international wire transfers.

    Critical Features for Beginner Success

    Mobile App Quality

    Robinhood and SoFi are built mobile-first, with deliberately simplified interfaces. Schwab and Fidelity offer full-featured mobile apps that mirror their web platforms — more powerful but slightly more to navigate. E*TRADE’s dual-app approach (standard + Power E*TRADE) is smart for beginners who want room to grow without switching brokers.

    Research and Education

    Fidelity and Schwab provide the deepest educational libraries among retail brokers — video tutorials, webinars, and curated beginner learning paths. Schwab sources research from 20+ independent third-party providers. Robinhood offers minimal research content, which is a real limitation for beginners trying to evaluate individual stocks.

    Account Types Available

    For tax-efficient investing, verify your broker supports the account types you need:

    • Taxable brokerage: All seven platforms.
    • Traditional and Roth IRA: All seven platforms.
    • HSA: Fidelity (Fidelity HSA®); not available at Robinhood, SoFi, or Ally as standalone investing HSAs.
    • 529 college savings: Fidelity and Schwab; not available at Robinhood or SoFi.

    Fractional Shares

    Fractional shares let you invest in high-priced stocks with any dollar amount. Robinhood, Fidelity, Schwab, SoFi, and IBKR Lite all support fractional shares. E*TRADE and Ally do not. If you want to allocate $50 to a stock trading above $200 per share, this feature is essential.

    Customer Support

    Schwab and Fidelity offer 24/7 phone and chat support plus walk-in branches. Interactive Brokers’ support is limited outside market hours. Robinhood and SoFi rely primarily on in-app chat, which is adequate for common questions but can be slow during high-traffic market events.

    Best Platforms by Use Case

    Best for Ultra-Simplicity: Robinhood

    Robinhood’s interface removes nearly every barrier. You can complete signup, verification, and your first trade in under 10 minutes. If your only goal right now is to buy a few stocks or ETFs from your phone without reading a user manual, Robinhood delivers that experience better than anyone else on this list.

    Best for Long-Term Buy-and-Hold: Fidelity or Schwab

    Both platforms offer extensive retirement planning tools, no-transaction-fee mutual fund access, and 24/7 support. Fidelity’s Fidelity Go® robo-advisor is free for accounts under $25,000. Schwab’s Intelligent Portfolios® requires $5,000 to start but charges no advisory fee. Either is an excellent home for a Roth IRA or Traditional IRA.

    Best for Active and Options Traders: IBKR Lite or E*TRADE

    IBKR Lite offers professional-grade tools and order types that most retail brokers don’t provide. E*TRADE’s Power E*TRADE platform includes advanced charting and a paper trading mode. Both charge $0.65 per options contract. IBKR Lite edges ahead on total cost transparency; E*TRADE edges ahead on beginner-friendliness within the active-trading category.

    Best for Cost-Conscious Accounts: Ally or IBKR Lite

    Ally’s $0.50 options contract fee is below the $0.65 industry standard. IBKR Lite eliminates annual IRA fees and passes along order liquidity rebates. Both have $0 minimums and $0 inactivity fees. For accounts where every dollar counts, these two minimize costs beyond the commission headline.

    Best for Investors Seeking Guidance: Fidelity

    Fidelity’s combination of free robo-advisor access (under $25,000 balance), 100+ physical branches, 24/7 support, and deep educational resources makes it the strongest all-around choice for a beginner who expects to have questions and wants human or near-human support available.

    How to Get Started: Your Action Steps

    1. Define your investor profile. Are you a buy-and-hold retirement saver, a casual mobile investor, or someone interested in options? Your answer determines which platform from this guide fits best. If you’re unsure, start with Fidelity or Schwab — both grow with you as your strategy evolves.
    2. Open your account. Download the app or visit the broker’s website. Identity verification (government ID, SSN, and basic personal details) typically takes 5–10 minutes. Most accounts are approved same-day.
    3. Link your bank account via ACH — not instant deposit. Standard ACH transfers take 3–5 business days but are free at every broker on this list. Robinhood charges $5 for instant access to deposited funds. Skip that fee unless you need to trade immediately.
    4. Start with the broker’s educational resources before trading. Fidelity and Schwab provide structured beginner guides covering market orders vs. limit orders, what ETFs are, and how to read a stock quote. Spend 30–60 minutes here before placing a real trade — it will prevent common order-entry mistakes.
    5. Make your first trade with a low-cost index ETF. Options like VOO (Vanguard S&P 500 ETF, expense ratio 0.03%), VTI (Vanguard Total Stock Market ETF, 0.03%), or SCHB (Schwab U.S. Broad Market ETF, 0.03%) give you instant diversification at near-zero ongoing cost. If the share price is high and your broker supports fractional shares, start with $25–$50 to test the platform mechanics.
    6. Review your account statement quarterly. Look for unexpected fees — inactivity charges, spread widening on thinly traded securities, or foreign transaction costs if you traded an ADR. If fees appear that were not disclosed upfront, compare alternatives and switch platforms if necessary. Account transfers (ACATS) are typically free or low-cost at the receiving broker.

    Bottom Line

    Commission-free stock trading is now the floor, not a competitive advantage. The brokers that actually serve beginners well in 2026 are the ones that pair zero commissions with transparent fee structures, strong educational content, and reliable mobile apps.

    For most first-time investors, Fidelity or Schwab offer the best combination of $0 commissions, robust education, retirement account support, and 24/7 customer service. If simplicity is your only priority, Robinhood gets you started in minutes. If you’re cost-obsessed and plan to grow into advanced tools, IBKR Lite eliminates nearly every non-trade fee in the industry.

    Whatever platform you choose, the most important step is starting. Time in the market — invested in low-cost index funds — has historically outweighed timing the market or optimizing broker selection. Pick a platform that removes friction for you personally, open the account this week, and revisit platform choice annually as your needs evolve.

  • Fidelity Go vs. Schwab vs. E*TRADE: Best Robo-Advisors

    Fidelity Go vs. Schwab vs. E*TRADE: Best Robo-Advisors


    Fidelity Go vs. Schwab Intelligent Portfolios vs. E*TRADE Core Portfolios: Which Robo-Advisor for Hands-Off Investors?

    Hands-Off Investing at the Big Three

    Robo-advisors from Fidelity, Charles Schwab, and E*TRADE remove the most time-consuming parts of investing—picking securities, setting allocations, and rebalancing when markets drift. Each platform uses an algorithm to build and maintain a diversified portfolio based on your risk tolerance, time horizon, and goals. You answer a questionnaire and the platform handles the rest.

    But “automated” does not mean identical. Advisory fees range from 0% (Schwab at any balance; Fidelity under $25,000) to 0.35% annually (Fidelity at $25,000 and above) to a flat 0.30% (E*TRADE at every balance level). Account minimums span from effectively $10 (Fidelity Go) to $500 (E*TRADE) to $5,000 (Schwab). All three are primarily algorithm-driven products, though Fidelity Go includes access to human financial advisors for accounts with a balance of $25,000 or more—without requiring a separate premium product or upgrade fee.

    The platform that saves you the most money over time depends almost entirely on your starting balance and how quickly you plan to grow. Here is what each one actually costs, how each handles its core function, and which type of investor each fits best.


    Fee & Minimum Comparison: Where Your Money Goes

    Below is a direct side-by-side of all three platforms on the metrics that matter most to a cost-conscious, hands-off investor.

    Feature Fidelity Go Schwab Intelligent Portfolios E*TRADE Core Portfolios
    Annual Advisory Fee 0% under $25,000; 0.35% at $25,000+ 0% (no advisory fee at any balance) 0.30% flat
    Account Minimum to Open $0 (must have $10 to invest) $5,000 $500
    Maintenance Threshold None stated $5,000 $450 (management pauses below this)
    Underlying Fund Costs $0 (Fidelity Flex funds, zero expense ratio) ETF operating expenses apply (including Schwab ETFs) ETF operating expenses apply
    Tax-Loss Harvesting Available for taxable accounts at $25,000+ Yes (at $50,000+; must opt in) No (tax-sensitive ETFs offered instead)
    Human Advisor Access Included at $25,000+ (no upgrade required) No (premium tier discontinued) Investment Advisor Representatives available for financial planning guidance
    Auto-Rebalancing Yes Yes (monitored daily; rebalances as needed) Yes (drift-based and semiannual)
    Portfolio Customization Minimal (eight preset risk portfolios) 80+ variations; no manual adjustments SRI and smart beta ETF strategies available; investment strategy can be updated by retaking the questionnaire

    Real-Dollar Cost Examples

    To make the fee comparison concrete, here is what each platform costs annually at three common portfolio sizes:

    • $10,000 portfolio: Fidelity Go = $0 | Schwab = $0 | E*TRADE = $30/year
    • $50,000 portfolio: Fidelity Go = $175/year | Schwab = $0 | E*TRADE = $150/year
    • $100,000 portfolio: Fidelity Go = $350/year | Schwab = $0 | E*TRADE = $300/year

    The fee comparison breaks into two clear phases. Under $25,000, both Fidelity Go and Schwab charge zero in advisory fees, while E*TRADE charges 0.30%—making both free options cheaper for smaller balances. Once a portfolio crosses $25,000, Fidelity’s fee rises to 0.35%, which is immediately higher than E*TRADE’s flat 0.30%. From that threshold forward, E*TRADE is less expensive than Fidelity on a percentage basis, though Schwab continues to charge nothing at any balance. These are advisory-only fees; all three platforms still pass through underlying ETF or fund operating expenses, though Fidelity Go eliminates even those by using zero-expense-ratio Fidelity Flex mutual funds.


    Fidelity Go: Best for Starting Small and Scaling Slowly

    Fidelity Go is the clearest choice for investors with less than $25,000 to deploy. Zero advisory fees remove all cost friction during the early, critical phase when account balances are small and every dollar of return matters most. The platform reinforces this cost advantage by using Fidelity Flex funds—proprietary mutual funds with zero expense ratios—so there are no hidden fund costs eating into returns.

    How It Works

    After completing a risk questionnaire covering goals, time horizon, and risk tolerance, Fidelity Go places you into one of eight preset risk portfolios. The algorithm handles asset allocation and rebalances automatically as needed. There is no minimum required to open an account, but your balance must reach at least $10 before Fidelity begins investing the funds.

    What Unlocks at $25,000

    Crossing the $25,000 balance threshold triggers three meaningful changes simultaneously. First, the advisory fee rises from 0% to 0.35% annually—on a $26,000 balance, that is approximately $91 per year where there previously were none. Second, Fidelity Go unlocks access to Fidelity advisors for calls and guidance at no additional cost beyond the fee step-up, with no separate product required. Third, tax-loss harvesting becomes available for taxable accounts at this balance level. Below $25,000, none of these three features apply.

    Key Limitations

    • No individual customization: You cannot select specific ETFs or adjust sector exposure at any balance level. The preset portfolios are fixed by Fidelity’s algorithm.
    • Tax-loss harvesting restricted to taxable accounts at $25,000+: Investors with smaller balances or tax-advantaged accounts (IRA, 401k) do not have access to this feature.
    • Fee jump is abrupt: The 0%-to-0.35% transition is binary, not gradual. There is no intermediate tier.

    Ideal for: Beginners, investors with balances under $25,000, and anyone already using the Fidelity ecosystem who wants seamless account integration without paying for advice during the portfolio-building phase.


    Schwab Intelligent Portfolios: Best for Long-Term Zero-Fee Growth

    Schwab Intelligent Portfolios is the only one of the three platforms that charges no advisory fee at any balance level—ever. For an investor who plans to hold a $100,000 or $500,000 portfolio for decades, that zero-fee structure produces a compounding cost advantage that no percentage-based competitor can match.

    How It Works

    Schwab’s algorithm monitors portfolios daily and rebalances automatically to keep allocations aligned with the selected risk profile. Over 80 portfolio variations are available based on an intake questionnaire. The $5,000 account minimum is the highest entry barrier of the three platforms, which effectively excludes many new or early-stage investors from the start.

    Tax-Loss Harvesting

    Schwab Intelligent Portfolios offers tax-loss harvesting for accounts with $50,000 or more in invested assets. Importantly, this feature is not automatic—clients must actively enable it. When activated, the algorithm monitors for opportunities to sell positions at a loss and immediately reinvest in similar (but not substantially identical) securities to preserve market exposure while realizing a tax benefit.

    The Cash Drag Issue

    Schwab’s approach requires holding a cash allocation ranging from roughly 6% to 30% of the portfolio, depending on risk profile. This cash sits in a Schwab-affiliated bank account. While Schwab frames this as a volatility buffer, it has historically reduced returns relative to fully invested competitors. In 2022, Schwab paid $187 million to settle SEC charges related to this practice, which regulators found benefited Schwab at clients’ expense. The practice continues, and investors should factor in the real return impact of a forced cash holding before opening an account—particularly in strong market conditions where idle cash carries a significant opportunity cost.

    Key Limitations

    • $5,000 minimum: More than triple Fidelity Go’s effective entry point; inaccessible for many new investors.
    • Cash drag reduces net returns: A 10–15% cash allocation in a rising market can offset a meaningful portion of the advisory fee savings relative to a competitor charging 0.25% that stays fully invested.
    • No human advisor access: Schwab discontinued its Intelligent Portfolios Premium tier, leaving no current hybrid option bundled with this product.
    • Tax-loss harvesting requires $50,000 and manual opt-in: Not available to accounts below that threshold regardless of investor preference.

    Best for: Investors with $25,000 or more who prioritize minimizing fees over decades and can accept the cash drag trade-off in exchange for zero advisory costs.


    E*TRADE Core Portfolios: Best for Flat-Fee Predictability and Strategy Selection

    E*TRADE Core Portfolios occupies a middle position: a flat 0.30% annual fee that is more competitive than Fidelity Go above the $25,000 threshold, paired with strategic investment options that neither Fidelity nor Schwab provide. Its customization is bounded—investors cannot manually adjust sector weightings or hand-pick ETFs—but there is more strategic flexibility here than at the other two platforms.

    How It Works

    The $500 minimum opens the account. A $450 maintenance threshold applies: if the balance drops below this level due to withdrawals or market losses, E*TRADE pauses active management until the balance recovers. The platform rebalances based on portfolio drift and on a semiannual schedule. Tax-sensitive ETF options are available in taxable accounts, which can reduce dividend drag—a practical benefit even without formal tax-loss harvesting.

    Customization: What You Can and Cannot Change

    E*TRADE Core Portfolios offers meaningful but bounded strategic choices. Investors can select from portfolios built with socially responsible (SRI) ETFs or smart beta ETFs as alternatives to standard index funds. If investment priorities change after setup, clients can update their portfolio strategy by retaking the investor profile questionnaire, which generates a revised allocation. However, E*TRADE does not allow investors to manually adjust individual sector weightings or select specific ETFs after the initial portfolio is built—those decisions remain with the algorithm. The distinction matters: you are choosing a strategy, not engineering a portfolio.

    Advisor Access

    Unlike Schwab’s standard tier, E*TRADE Core Portfolios clients have access to Investment Advisor Representatives for financial planning guidance. This is part of E*TRADE’s customer support structure and is distinct from a dedicated certified financial planner (CFP) relationship, but it means investors are not entirely limited to algorithmic outputs if they have questions about their portfolios or broader financial decisions.

    Fee Predictability

    At 0.30% flat, E*TRADE’s pricing is consistent at any balance. There is no threshold-based fee jump like Fidelity’s 0%-to-0.35% transition. For an investor scaling a portfolio from $50,000 to $200,000 over time, the math is straightforward: $150/year at $50k, $300/year at $100k, $600/year at $200k. That predictability makes multi-year cost planning easier, even though E*TRADE is never the lowest-cost option.

    Key Limitations

    • No tax-loss harvesting: Despite offering tax-sensitive ETFs, E*TRADE Core Portfolios does not provide automated tax-loss harvesting—a notable gap relative to Schwab (at $50,000+) and third-party providers like Betterment and Wealthfront.
    • Fee applies at every balance: Even at small balances where both Fidelity and Schwab charge nothing, E*TRADE charges 0.30%.
    • $450 maintenance threshold: A market downturn that pushes a near-minimum account below this level temporarily suspends management—a practical risk for investors starting close to the $500 floor.
    • No manual control over holdings: Sector and ETF adjustments cannot be made directly; strategic changes require retaking the investor questionnaire.

    Ideal for: Investors above the $25,000 balance level who want a predictable flat fee, prefer SRI or smart beta portfolio strategies, and value access to investment advisor representatives without needing a full CFP relationship.


    Who This Is Best For: Match Your Profile to the Right Platform

    No single platform wins across all investor types. Use the framework below to identify the strongest match based on your actual situation:

    Your Situation Best Fit Reason
    Starting balance under $25,000 Fidelity Go Zero fees eliminate cost drag during the most vulnerable early growth stage
    Balance $25,000+ and fee-averse long-term Schwab Intelligent Portfolios Zero advisory fee compounds significantly over long holding periods
    Want a flat, predictable fee above $25,000 E*TRADE Core Portfolios 0.30% flat is cheaper than Fidelity’s 0.35% at every balance above the $25,000 threshold
    Want SRI or smart beta investment strategies E*TRADE Core Portfolios Only platform of the three offering these as selectable portfolio strategies
    Prioritize tax-loss harvesting Schwab ($50,000+) or Betterment/Wealthfront (broader coverage from lower balances) E*TRADE offers no TLH; Fidelity Go offers TLH only for taxable accounts at $25,000+; Schwab requires $50,000+
    Already using Fidelity accounts Fidelity Go Seamless integration across IRAs, 401(k)s, and taxable accounts in a single dashboard
    Want human advisor access without a premium upgrade Fidelity Go ($25,000+) Advisor access is built into the base tier at $25,000+; no separate product or additional fee required beyond the standard 0.35%
    Completely hands-off, set-and-forget approach Fidelity Go (under $25k); Schwab (over $25k) Lowest combined advisory costs for the purely passive investor at each balance tier

    Limitations and When to Look Elsewhere

    These three platforms share structural limitations that make them a poor fit for certain investors, regardless of fee structure.

    Human Advisor Access Is Limited or Absent at Most Tiers

    Fidelity Go is the only one of the three that includes access to a Fidelity advisor as part of its standard offering—but only at $25,000 or more. E*TRADE Core Portfolios offers access to Investment Advisor Representatives for guidance, but not to certified financial planners (CFPs). Schwab discontinued its Intelligent Portfolios Premium tier, leaving no current hybrid option bundled with that product. Investors who want a CFP as part of their ongoing advisory relationship should look at dedicated hybrid services:

    • Vanguard Digital Advisor: Approximately 0.15% all-in annual fee; CFP access available at $50,000+ via Vanguard Personal Advisor Services (0.30%)
    • Merrill Guided Investing: Advisor-assisted tier available with percentage-based pricing
    • SoFi Automated Investing: Low cost with access to financial planners included at no extra charge

    Tax-Loss Harvesting Gap

    E*TRADE Core Portfolios does not offer tax-loss harvesting at any balance level. Fidelity Go offers it only for taxable accounts at $25,000 or more. Schwab requires a $50,000 minimum and manual opt-in. For investors in the 22%+ federal bracket holding taxable accounts of any meaningful size, these restrictions have real dollar consequences. Betterment and Wealthfront both provide tax-loss harvesting starting from the first dollar invested—at a lower annual fee than Fidelity charges above $25,000.

    Schwab’s Cash Drag Is an Ongoing Hidden Cost

    Schwab’s zero advisory fee is genuine, but the required cash allocation—which can reach 30% of portfolio value depending on risk profile—carries a real opportunity cost in foregone returns. Over a long holding period, a 10–15% cash allocation in a rising market can offset a meaningful portion of the advisory fee savings relative to a 0.25% competitor that stays fully invested. This is not a disclosed fee, but it functions like one.

    Alternatives Worth Considering

    • Betterment: No minimum investment. Fee structure: $5/month for household balances under $24,000 (waived if recurring deposits of at least $200/month are enabled); 0.25% annually for balances of $24,000 or more or with qualifying recurring deposits. Tax-loss harvesting available from the first dollar.
    • Wealthfront: 0.25% annual fee; $500 minimum; tax-loss harvesting included from the start
    • Vanguard Digital Advisor: Approximately 0.15% all-in—the lowest total cost among major robo-advisors for long-term passive investors

    What to Do Next: Your Action Plan

    If you are ready to open an account, use this sequence to move efficiently:

    1. Determine your starting balance.

      • Under $25,000: Open a Fidelity Go account. The zero-fee structure is unmatched at this level, and every dollar stays invested.
      • $25,000 or more and focused on minimizing long-term fees: Evaluate Schwab Intelligent Portfolios, but review their cash allocation policy before committing.
      • $25,000 or more and want a predictable flat fee: E*TRADE Core Portfolios at 0.30% is cheaper than Fidelity Go’s 0.35% at every balance above this threshold.
    2. Rank your priorities. Choose one driver and let it guide your decision:

      • Lowest possible fees → Schwab (zero forever) or Fidelity (zero under $25k)
      • Ecosystem integration and simplicity → Fidelity Go
      • Flat predictable pricing above $25,000 → E*TRADE Core Portfolios
      • Tax-loss harvesting → Schwab (if $50k+), Fidelity Go (if $25k+ in a taxable account), or Betterment/Wealthfront for the broadest coverage from the lowest balance
      • Built-in advisor access at no extra tier → Fidelity Go at $25,000+
    3. Check existing account relationships. If you already hold a Fidelity 401(k), IRA, or brokerage account, Fidelity Go adds robo-advisory management without creating a separate platform login. Schwab and E*TRADE function as standalone services even if you have existing accounts elsewhere.
    4. Open and fund the account. Account setup takes roughly five minutes on any of the three platforms. Minimum deposits: $10 effective minimum (Fidelity Go), $500 (E*TRADE), $5,000 (Schwab).
    5. Set a 12-month calendar review. Automatic rebalancing handles day-to-day drift, but major life changes—new job, inheritance, home purchase, approaching retirement—may require updating your risk profile or reconsidering whether your current platform still fits your balance and goals.

    This article is for informational purposes only and does not constitute personalized financial, tax, or legal advice. Fee structures and account minimums reflect publicly available information as of early 2026 and are subject to change. Verify current terms directly with each provider before opening an account.

  • Best Micro-Investing Apps for Beginners: Acorns vs M1 vs Stash

    Best Micro-Investing Apps for Beginners: Acorns vs M1 vs Stash


    Acorns vs M1 Finance vs Stash: Which Micro-Investing App Is Best for Beginners in 2026?

    Introduction: Choosing Your First Micro-Investing App

    Micro-investing apps have removed one of the biggest obstacles to getting started: the idea that you need a lot of money. Acorns lets you invest spare change from everyday purchases. M1 Finance charges no base account fees. Stash allows you to open an account with $0, though a minimum of $5 is required to start investing in its Smart Portfolios. All three are built for beginners, but they take fundamentally different approaches to helping you grow wealth.

    The differences matter. Acorns handles everything for you—portfolio selection, rebalancing, and even the decision of when to invest. M1 Finance gives you far more control without overwhelming complexity. Stash sits closest to the DIY end of the spectrum, pairing individual stock access with educational content designed to help you understand what you own.

    This comparison covers fees, features, account minimums, investment options, and ideal investor profiles for each platform as of 2026, so you can pick the right one and start this week.

    Disclaimer: This article is for informational purposes only and does not constitute personalized financial, tax, or legal advice.

    Who Each App Is Best For: Investor Profiles at a Glance

    Before diving into the details, here is a plain-English summary of who each platform actually serves well:

    • Acorns: Absolute beginners with zero investing experience who want complete automation and no learning curve. If you want to link a card and forget about it, Acorns is your platform.
    • M1 Finance: Curious beginners and intermediate investors who want flexibility—either through expert-built “Pie” portfolios or custom allocations—without paying a monthly base fee.
    • Stash: DIY learners who want to understand their investments, own individual stocks, and build confidence through guided exploration rather than full automation.

    All three work for investors starting small—under $1,000—and building through regular micro-deposits over time. The right choice depends less on your balance and more on your personality and how involved you want to be.

    Feature & Fee Comparison: The Key Numbers

    Feature Acorns M1 Finance Stash
    Base Fee $3–$5/month $0 (core investing) Subscription (varies by tier)
    Account Minimum to Invest $5 $0 $5 (Smart Portfolios); lower for self-directed
    Investment Options Fractional ETFs only Stocks, ETFs (fractional shares) Stocks, ETFs, bonds
    Automated Portfolio Yes (risk-based) Yes (Expert Pies or custom) Yes (Smart Portfolios managed option)
    Automated Rebalancing Yes Yes No (on self-directed accounts)
    Spare-Change Feature Yes (Round-Ups on any linked card) No Yes (Stock Round-Ups via Stock-Back® Card)
    Cashback / Rewards Brand partnerships No Stock-Back® cashback
    Tax-Loss Harvesting No No (core plan) No
    Integrated Banking Yes (checking + savings) Yes (cash account) Yes (banking features)
    IRA Available Yes Yes Yes
    Mobile Platforms iOS and Android iOS and Android iOS and Android

    M1 Finance is the only platform with no base monthly fee for core investing. Acorns and Stash charge monthly subscriptions, which can erode returns significantly on small balances—something every beginner should factor in before choosing.

    Acorns: Best for Fully Automated Micro-Investing

    Acorns built its brand on one idea: remove every barrier between a beginner and their first investment. The Round-Ups feature rounds up purchases on any linked debit or credit card to the nearest dollar and invests the difference. When accumulated spare change hits the $5 threshold, it moves automatically into your investment account. According to Acorns, the average user invests more than $30 per month this way—without making a single deliberate decision.

    How Acorns Portfolios Work

    During setup, you answer a few questions about your risk tolerance and time horizon. Acorns assigns you one of its five pre-built ETF portfolios—ranging from Conservative to Aggressive—and handles all rebalancing automatically. You never pick individual securities. You never decide when to buy or sell. For someone who finds financial decisions anxiety-inducing, this is a genuine advantage.

    Acorns Subscription Tiers (2026)

    • Acorns Personal ($3/month): Includes the core Invest account, a Later IRA, and a Checking account. Covers the essentials for most single investors and beginners.
    • Acorns Family ($5/month): Adds Early—custodial investment accounts for children—making it the right choice for parents who want to invest for their kids alongside themselves.

    The Fee Math You Need to Do

    At $3/month on the Personal plan, you are paying $36/year. On a $500 portfolio, that is a 7.2% annual fee drag—far higher than any index fund’s expense ratio. On a $5,000 portfolio, it drops to 0.72%, which is more reasonable. If you are starting with very small amounts, the fee-to-balance ratio warrants close attention. Acorns makes the most financial sense when Round-Ups and recurring deposits push your balance past a few hundred dollars quickly.

    Acorns Pros and Cons

    • Pros: Lowest learning curve of the three, intuitive app design, effortless onboarding, strong brand partnerships for bonus investments, integrated banking ecosystem
    • Cons: Monthly subscription fee, no individual stocks, limited portfolio customization, no tax-loss harvesting, fee impact is high on small balances

    M1 Finance: Best for Control Without Complexity

    M1 Finance occupies an unusual position: it is simultaneously a zero-fee robo-advisor and a flexible self-directed brokerage. The core product charges nothing for standard investing accounts, which immediately separates it from Acorns and Stash on cost.

    How M1 Finance’s Pie System Works

    M1 organizes portfolios visually as “Pies”—circular charts where each slice represents a stock or ETF with a target allocation percentage. You can build a custom Pie from thousands of individual stocks and ETFs, or choose from pre-built Expert Pies designed around themes like Responsible Investing, Retirement Income, or General Investing by risk level.

    For a beginner who wants hands-off management, selecting an Expert Pie takes about two minutes and delivers a diversified, automatically rebalanced portfolio at zero cost. For someone who wants to own a specific stock, a broad market ETF, and a bond fund in precise proportions, M1 handles that too—automatically rebalancing by buying into underweight positions when new deposits arrive.

    What M1 Finance Costs in 2026

    • Core investing: $0/year for taxable accounts, IRAs, and custodial accounts
    • M1 Plus (formerly M1 Premium): $10/month or $125/year for lower margin rates, a high-yield cash account, and advanced analytics tools
    • Margin borrowing: Available on accounts over $2,000; rates vary by tier

    For a beginner who only needs a standard investment account, the total annual cost is $0. That is a meaningful advantage while your portfolio is small. M1 Plus is entirely optional and geared toward users who want enhanced borrowing rates or premium analytics—not a requirement for getting started.

    Recent Additions: AI-Powered Optimization

    In 2025–2026, M1 introduced AI-assisted portfolio tools that analyze your current allocations and suggest refinements based on your stated goals. These features are optional—you can ignore them entirely and stick to a simple Expert Pie—but they add value for users who want to grow their investing sophistication over time without switching platforms.

    M1 Finance Pros and Cons

    • Pros: No base fees for core investing, fractional shares on thousands of securities, Expert Pies for hands-off management, high customization for advanced users, transparent pricing
    • Cons: Initial setup requires more effort than Acorns, no Round-Ups or spare-change automation tied to everyday card spending, learning curve steeper than Acorns for beginners building custom allocations

    Stash: Best for Education-Driven Beginners

    Stash takes the most hands-on approach of the three. Where Acorns automates everything and M1 Finance automates on demand, Stash puts you in the driver’s seat and provides tools to make informed decisions. That approach appeals to a specific type of beginner: one who is motivated to learn rather than delegate.

    Individual Stocks and the Learning Advantage

    Stash lets you buy fractional shares of individual stocks alongside ETFs and bonds. Owning a $10 slice of a company you recognize—Amazon, Tesla, or a healthcare ETF that aligns with your values—creates a psychological connection to investing that pure automation cannot replicate. For beginners who check their portfolio frequently and want to understand why it moves, this engagement is a real advantage over fully automated platforms.

    Stock Round-Ups and Stock-Back® Rewards

    Stash offers two related but distinct passive investment features for Stock-Back® Card users. The Stock-Back® rewards program functions like a cashback card: eligible purchases earn fractional shares of companies in the relevant sector—buy groceries and potentially earn a fractional share of a grocery retailer. On top of that, Stash’s Stock Round-Ups feature automatically invests spare change from qualifying purchases made with the Stock-Back® Card, adding an Acorns-style micro-investing layer for cardholders. Together, these two features let users build positions passively alongside their manual contributions.

    How Stash Guides Investment Choices

    Stash organizes investment options through a “Discover” feature that categorizes choices by personal values: “I Believe,” “I Want,” and “I Like.” This makes the selection process feel less like reading a financial prospectus and more like answering preference questions. That said, some reviews note the categories are not always intuitive—for example, “I Want” groups both conservative mixed portfolios and infrastructure funds together, which requires a second look to understand the logic.

    Stash also offers Smart Portfolios—a managed account option for users who want less hands-on involvement. Smart Portfolios require a minimum of $5 to begin investing, bridging the gap between Stash’s DIY roots and the automation Acorns provides.

    Stash Limitations Worth Knowing

    Stash is available on both iOS and Android, making it accessible across smartphone platforms. The platform charges a monthly subscription fee, and unlike M1 Finance, self-directed accounts do not include automated rebalancing—portfolio management stays manual unless you opt into Smart Portfolios. The interface, while improving, has historically drawn criticism for being less intuitive than Acorns, which is worth weighing if ease-of-use is a top priority.

    Stash Pros and Cons

    • Pros: Individual stock access builds financial literacy, Stock Round-Ups and Stock-Back® rewards add a passive investment layer, educational content for learning-oriented users, guided value-based investment discovery, available on iOS and Android
    • Cons: Monthly subscription fee, no automatic rebalancing on self-directed accounts, less intuitive UI compared to Acorns, requires active portfolio management unless using Smart Portfolios

    Automation vs. Control: Where They Differ Most

    The most important axis separating these three platforms is how much they ask of you. Here is how they stack up across the dimensions beginners care about most:

    Automation Spectrum

    Acorns sits at the fully automated end. Once you link a card and choose a risk profile, investing happens without any further input. M1 Finance sits in the middle—it automates rebalancing and recurring deposits, but you decide what goes in your portfolio (or choose an Expert Pie). Stash sits at the most manual end, requiring you to select investments and manage allocations yourself unless you use Smart Portfolios.

    Investment Options

    Acorns is ETF-only—you cannot buy individual stocks under any plan. M1 Finance and Stash both offer individual stocks via fractional shares, which matters if you want exposure to specific companies or want to learn by owning familiar names. M1 Finance provides access to the broader universe, while Stash curates its selection with a learning-first lens.

    Fee Efficiency at Small Balances

    Consider a beginner with $500 invested for 12 months:

    • Acorns Personal ($3/month): $36/year in fees = 7.2% annual fee drag before any market returns
    • M1 Finance (core): $0/year in base fees = 0% fee drag
    • Stash (entry tier): Subscription fee applies; comparable drag to Acorns at small balances

    At $500, M1 Finance’s zero-fee structure preserves significantly more of your returns. At $5,000, the math shifts: Acorns’ $36/year becomes a 0.72% effective fee—higher than most index ETFs but not catastrophic for the level of automation it provides.

    Passive Investment Triggers

    Both Acorns and Stash offer spare-change investing, but through different mechanisms. Acorns Round-Ups work on any linked debit or credit card, automatically sweeping the difference into your account once it reaches $5—averaging $30+ per month for typical users. Stash’s Stock Round-Ups work similarly but are tied specifically to the Stock-Back® Card rather than all linked accounts. M1 Finance has no spare-change feature and relies on scheduled recurring deposits you set up manually. If you need investing to happen automatically without deliberate action, Acorns’ broader card-linking capability gives it a clear edge in driving contribution frequency.

    What to Do Next: Your Action Plan

    Choosing the right platform matters far less than starting. Here is a practical decision framework:

    Choose Acorns If:

    • You want zero friction and maximum simplicity
    • You find financial decisions stressful or overwhelming
    • You prefer investing to happen passively through daily spending on any linked card
    • You are comfortable paying $3/month for complete automation

    Action: Download Acorns, link a debit or credit card, pick Conservative or Moderate based on your time horizon, and enable Round-Ups today.

    Choose M1 Finance If:

    • You want no monthly base fee while your balance is small
    • You want the flexibility to choose individual stocks or use pre-built Expert Pies
    • You can spend 20–30 minutes on initial setup in exchange for long-term fee savings
    • You plan to grow beyond basic ETF portfolios over time

    Action: Open a free M1 Finance account, select an Expert Pie matching your risk tolerance, set up a recurring weekly or monthly deposit, and let it run.

    Choose Stash If:

    • You are motivated to understand what you own
    • You want to buy individual stocks alongside ETFs
    • You want integrated Stock-Back® rewards and Stock Round-Ups through a debit card
    • Educational content and guided investing matter to you

    Action: Download Stash on iOS or Android, explore the Discover section, purchase fractional shares of one ETF and one individual company you recognize, and set a small monthly recurring deposit.

    The Most Important Step: Start Now

    Time in the market consistently outperforms timing the market. A beginner who invests $50/month starting at age 25 and earns a 7% average annual return will have approximately $131,000 by age 65. The same investor starting at 35 accumulates roughly $61,000—a $70,000 difference from waiting just 10 years, despite contributing the same monthly amount.

    Pick the platform that matches your personality, open the account this week while your motivation is high, and automate at least one recurring contribution. The platform you actually use consistently will outperform the theoretically optimal one you keep meaning to sign up for.

  • Masterworks Review 2026: Fractional Art Investing

    Masterworks Review 2026: Fractional Art Investing


    Masterworks Review 2026: Is Investing in Fractional Fine Art a Smart Portfolio Move?

    Masterworks lets everyday investors buy fractional shares of blue-chip paintings—works by Picasso, Basquiat, and Warhol—that historically trade at prices only museums and billionaires can afford. Since its 2017 launch, the platform has completed 23 artwork sales, each profitable, with annualized net returns ranging from roughly 6% to over 21% depending on the piece and holding period.

    That track record sounds compelling. But Masterworks carries real risks: capital lock-up of 2–4+ years, a fee structure that takes 1.5% annually plus 20% of profits, and a market that is notoriously hard to predict. This review breaks down exactly how the platform works, who it suits, what it costs, and whether the returns hold up after fees and selection bias.

    Disclosure: This article is for informational purposes only and does not constitute personalized financial, tax, or legal advice. Past performance does not guarantee future results.


    Who Masterworks Is Best For

    Masterworks is not a fit for every investor. Before reviewing the mechanics, consider whether your financial profile matches what the platform actually requires:

    • Long-term investors with patience: Plan to lock up capital for at least 2–4 years, potentially longer. The platform is explicitly not designed for short-term needs.
    • Portfolio diversifiers with available capital: Meaningful diversification requires spreading $5,000–$25,000+ across multiple offerings. A single $1,000 stake is not portfolio diversification.
    • High-risk-tolerance investors: Art is a speculative asset class. You should be financially prepared to lose your full investment.
    • Investors seeking low-correlation assets: Contemporary art has historically shown low correlation to equities and bonds, which can buffer a portfolio during market downturns.
    • Investors age 70 or younger: Masterworks does not accept account holders over age 70, reflecting the illiquid, long-horizon nature of the investment.

    If you are a retiree, carry high-interest debt, or need liquidity within two years, Masterworks is not appropriate regardless of its historical returns.


    How Masterworks Works: The Mechanics

    Masterworks operates in three stages: acquisition, securitization, and eventual sale.

    Step 1: Artwork Acquisition

    Masterworks’ curatorial team analyzes auction data and market trends to identify blue-chip artworks likely to appreciate. Target artists include household names like Pablo Picasso, Jean-Michel Basquiat, and Andy Warhol. The platform acquires the physical artwork outright.

    Step 2: SEC Registration and Share Offering

    Each acquired painting is registered with the U.S. Securities and Exchange Commission (SEC) as a security. This registration legally enables Masterworks to divide ownership into fractional shares and sell those shares to investors—both accredited and non-accredited. No single investor may own more than 10% of any individual artwork.

    Step 3: Holding Period and Management

    During the holding period, Masterworks handles all logistics: professional storage, insurance, authentication, and periodic appraisal. Investors are passive owners. Holding periods typically run 2–4 years, though Masterworks originally guided investors to expect 3–10 years. In practice, the average exit has occurred around the two-year mark.

    Step 4: Exit and Proceeds

    When Masterworks decides to sell an artwork—either via auction or private sale—proceeds are distributed to investors on a pro-rata basis after fees are deducted. Investors can also sell their shares early on Masterworks’ secondary market, though secondary market pricing depends on buyer demand and may result in a loss.


    Fee Structure and Investment Minimums

    Masterworks’ fee structure is straightforward, but the compounding impact on net returns is meaningful and should be modeled before investing.

    Fee Type Amount When Charged
    Annual management fee 1.5% of investment value per year Ongoing, per artwork
    Performance fee 20% of net profits At time of artwork sale
    Minimum investment ~$1,000–$5,000 per offering At investment entry
    Secondary market fees Disclosed per offering prospectus At secondary sale

    To put the fee drag in perspective: if an artwork sells for a 30% gross gain over three years, the 1.5% annual fee (~4.5% cumulative) and 20% profit share (~6% of proceeds) would reduce your net gain meaningfully. Always calculate net-of-fee returns using each offering’s specific prospectus before committing capital.

    For comparison, a passive S&P 500 index fund charges as little as 0.03%–0.10% annually with no performance fee. Masterworks’ higher fee structure is only justified if the artwork appreciates meaningfully above index returns.


    Track Record and Representative Returns (2017–2026)

    As of early 2026, Masterworks has completed 23 artwork sales since its founding. Every sale has returned a profit to investors—a notable record, though one that requires important caveats.

    Headline Numbers

    • 23 total sales, all profitable
    • Annualized net returns for longer holds (1+ year): 17.6%, 17.8%, and 21.5%
    • 2024 Basquiat exit: ~3.75-year hold, $8 million sale price, ~6.3% net annualized return. A $10,000 investment returned approximately $12,600 after fees.
    • Average holding period across all exits: ~2 years

    The Selection Bias Caveat

    Masterworks reports returns on artworks it has chosen to sell. It is reasonable to assume the team exits positions where they expect favorable outcomes. Artworks that are underperforming or caught in illiquid markets may still be in the holding phase, and their eventual returns—positive or negative—are not yet reflected in the published track record. This is a material limitation when evaluating the 23-sale record as predictive of future performance.

    Masterworks’ own CEO has noted that the company views these as long-term investments. The fact that average exits have occurred closer to two years—not the 3–10 year guidance investors originally received—suggests the team is proactively managing exit timing, which further supports the selection-bias interpretation.


    Pros: Why Masterworks Appeals to Alt-Asset Investors

    • Access to blue-chip art at scale: Museum-quality works by Basquiat, Warhol, and Picasso are otherwise accessible only to ultra-high-net-worth collectors or institutions. Masterworks democratizes entry at $1,000–$5,000 minimums.
    • SEC regulation reduces fraud risk: Each offering undergoes SEC registration, providing legal oversight and disclosure requirements absent from many alternative investment platforms.
    • Strong historical return profile: Annualized net returns of 17%+ outpace the S&P 500’s historical ~9.5% annualized average—and Citigroup’s analysis cited by Masterworks suggests contemporary art has averaged ~14% annually over 25 years versus equities’ 9.5%.
    • Low equity correlation: Art prices do not typically move in step with stocks or bonds. During equity bear markets, art holdings can provide a buffer.
    • Fully managed logistics: Storage, insurance, authentication, and appraisal are handled professionally. Investors hold shares, not physical canvases.
    • Secondary market liquidity option: If your circumstances change before an artwork sells, the secondary market provides a potential—though not guaranteed—exit route.

    Cons and Risk Factors

    • Illiquidity is the primary risk: Your capital is locked until Masterworks sells the artwork or you find a secondary market buyer. Secondary market transactions may close at a loss if demand is weak.
    • No guaranteed returns: Art prices are driven by taste, economic cycles, collector demand, and artist reputation—none of which are predictable. You can lose money.
    • Fee drag is significant: A 1.5% annual fee plus 20% profit share meaningfully erodes gross returns. On a 3-year hold with a 20% gross return, fees could reduce your net gain by 30–40% of profits depending on artwork appreciation.
    • Limited track record: Twenty-three profitable sales over nine years is promising but not statistically significant at the asset-class level. Curators’ ability to consistently identify winners over 20+ years remains unproven.
    • Concentration risk: Art should represent no more than 5–10% of a diversified portfolio. Overweighting any single alternative asset class increases risk disproportionately.
    • Tax inefficiency: Secondary market sales trigger capital gains tax. Unlike equity portfolios, there is no tax-loss harvesting mechanism available to offset gains.
    • Selection bias in reported returns: Only completed, profitable exits are publicly highlighted. The full return distribution—including still-held or less-promising works—is not transparent.

    Alternatives to Masterworks for Alternative Investing

    If you’re exploring portfolio diversification beyond stocks and bonds, Masterworks is one option among several. Here is how it compares:

    Platform / Option Asset Class Minimum Key Differentiator
    Masterworks Blue-chip fine art ~$1,000–$5,000 SEC-registered, 23 profitable exits
    Artemundi (Europe) Fine art (fractional) €50+ 17–38% expected annual return; 2–4 year horizon; 0% exit fee
    YieldStreet Real estate, infrastructure, art ~$2,500–$10,000 Diversified alternatives beyond art alone
    REITs / Real Estate Crowdfunding Real estate Varies ($500+) Higher liquidity, dividend income, more data history
    Traditional Art Galleries Physical artwork ownership $50,000+ Full ownership; no platform fees, but requires significant capital and expertise

    Artemundi is worth noting for European investors or those seeking low minimum entry (€50) and an exit-fee-free structure. YieldStreet offers a broader alternative-asset basket that may suit investors wanting diversification across multiple non-correlated asset classes within a single platform.


    Bottom Line: Smart Portfolio Move or Speculative Bet?

    Masterworks occupies a legitimate but narrow space in a well-constructed portfolio. The platform is SEC-regulated, its fee structure is disclosed, its track record is real—and 23 profitable exits over nine years is not nothing. But context matters:

    • Allocation limit applies: Masterworks should represent no more than 5–10% of your total portfolio. At 20–30% allocation, art exposure becomes a source of concentrated risk, not diversification.
    • Fees require meaningful appreciation to justify: The 1.5% annual fee plus 20% profit share makes sense only if underlying artwork consistently outperforms low-fee index alternatives. For shorter holds or modest appreciation, net returns may underwhelm.
    • $10,000+ across multiple offerings is the practical entry point: Spreading risk across 3–5 artworks requires committing at least $10,000–$25,000 to the platform. A single $1,000 stake in one painting is near-pure speculation.
    • The selection bias in reported returns is real: The 100% profitable exit rate is compelling but reflects Masterworks choosing when to sell. The full portfolio return—including unrealized holdings—is not publicly available.
    • Not for retirees, conservative portfolios, or investors with near-term liquidity needs. The 2–4 year lock-up and speculative nature of art as an asset class are incompatible with capital preservation goals.

    For a high-net-worth investor with a 5+ year horizon, a diversified portfolio, and the ability to absorb a total loss on the allocated amount, Masterworks is a reasonable speculative addition. For anyone else, the illiquidity and fee drag are difficult to justify compared to lower-cost alternatives.


    What to Do Next

    1. Determine your allocation ceiling first. Calculate 5–10% of your investable assets. If that number is below $5,000, Masterworks is not practical for meaningful diversification.
    2. Review 2–3 offering prospectuses before committing. Each artwork has its own SEC filing with specific fees, risk disclosures, and market context. Read them.
    3. Start with 1–2 artworks. Do not deploy your full planned allocation upfront. Evaluate your first investment before scaling.
    4. Compare Masterworks’ net-of-fee projected returns against YieldStreet or REIT alternatives relevant to your portfolio needs before deciding.
    5. Consult a fee-only financial advisor if Masterworks would represent more than 5% of your total net worth. Alternative assets with multi-year lock-ups require holistic portfolio context to evaluate properly.
  • Robinhood Gold Review: Is the $5 Subscription Worth It?

    Robinhood Gold Review: Is the $5 Subscription Worth It?


    Robinhood Gold Review 2026: Is the 3% IRA Match and 3.35% APY Worth the $5 Subscription?

    Robinhood Gold costs $5 per month. Whether that subscription pays for itself depends entirely on how you use your account. For some investors, a single benefit—the 3% IRA match, higher cash interest, or interest-free margin—covers the annual fee many times over. For others, it’s $60 a year spent on features they never touch.

    This review breaks down every core benefit with real numbers, calculates the break-even point for three distinct use cases, and compares Robinhood Gold against free alternatives as of April 2026.

    Quick verdict: Robinhood Gold is worth it if you contribute at least $1,667/year to an IRA, keep $1,500+ in uninvested brokerage cash, or actively use margin. If none of those apply, skip it.


    What Is Robinhood Gold and Who Should Consider It?

    Robinhood Gold is a premium subscription tier layered on top of Robinhood’s standard free investing account. It costs $5/month or $50/year (annual billing saves $10). New subscribers get a 30-day free trial with no commitment required.

    The subscription unlocks four meaningful features:

    • Higher APY on uninvested brokerage cash (3.35% vs. 1.5%)
    • 3% match on annual IRA contributions (vs. 1% without Gold)
    • $1,000 of interest-free margin
    • 0% management fee cap on Robinhood Strategies balances above $100,000

    Best for: Investors who regularly contribute to an IRA, hold a cash buffer between trades, or use margin. The 30-day trial makes it easy to test value before paying anything.

    Not ideal for: Investors with minimal account balances, no IRA contributions planned, and no interest in margin trading. The $5/month cost is only defensible if at least one benefit generates equivalent value.


    Robinhood Gold’s 3.35% APY on Uninvested Cash

    Gold members earn 3.35% APY on uninvested brokerage cash as of February 11, 2026. Standard (free) accounts earn 1.5% APY. The rate can change at Robinhood’s discretion and applies only to brokerage accounts—cash held in retirement accounts does not qualify.

    The Break-Even Math

    The annual subscription costs $50 (billed yearly). To cover that cost through interest alone:

    • At 3.35% APY, you need approximately $1,500 in uninvested cash to earn ~$50/year in extra interest (the 1.85% difference over 1.5% base rate).
    • Below $1,500 in idle cash, this benefit alone does not cover the subscription.

    This is useful for active traders holding cash between positions and buy-and-hold investors who accumulate cash before deploying it into the market. It is not a replacement for a high-yield savings account—more on that below.

    Honest Limitation

    3.35% APY is competitive within Robinhood’s ecosystem but not the highest available rate. Dedicated high-yield savings accounts at banks like Ally and Marcus were offering 5.25%–5.40% APY with no monthly fee and full FDIC insurance. If holding cash is your primary goal, a free HYSA outperforms Robinhood Gold on this metric alone.


    The 3% IRA Match: The Strongest Reason to Subscribe

    No major brokerage currently offers an IRA contribution match for self-directed retail accounts. Fidelity, Schwab, Vanguard, and E*TRADE all offer $0 match. Robinhood Gold’s 3% IRA match is genuinely differentiated—and it’s the primary reason the subscription is worth analyzing seriously.

    How the Match Works

    • Gold members receive a 3% match on eligible annual IRA contributions.
    • Non-Gold members receive a 1% match year-round.
    • The 2026 IRA contribution limit is $7,000 (under age 50) or $8,000 (age 50+).
    • At the $7,000 maximum: Gold members earn $210; non-members earn $70.
    • The match applies to contributions, IRA transfers from other brokers, and old 401(k) rollovers. It does not count toward your annual IRA contribution limit.

    Break-Even Threshold

    To cover the $50/year subscription cost through the IRA match alone, you need to contribute at least $1,667 annually. At 3%, that generates $50.01 in match value—just enough to break even. Every dollar contributed above $1,667 adds net positive return from the subscription.

    Annual IRA Contribution Match (1% Non-Gold) Match (3% Gold) Extra Value from Gold Net Gain After $50 Subscription
    $1,000 $10 $30 +$20 –$30
    $1,667 $16.67 $50.01 +$33.34 ~$0 (break-even)
    $4,000 $40 $120 +$80 +$30
    $7,000 $70 $210 +$140 +$90
    $8,000 (50+) $80 $240 +$160 +$110

    Critical Requirements You Cannot Ignore

    The IRA match comes with two conditions that materially affect its value:

    1. 12-month Gold membership requirement: You must maintain your Gold subscription for one full year after earning your first match. Cancel early and you forfeit the matched amount.
    2. 5-year vesting period: Matched funds must remain in the account for five years. Withdraw matched funds before the five-year mark and Robinhood charges a fee equal to the match amount earned on the withdrawn portion. For example, withdraw $1,000 that earned a $30 Gold match, and you owe $30 as an early removal fee.

    These are not minor footnotes. If there’s any chance you’ll need to access these funds within five years or cancel Gold within a year, factor that into your decision.

    Long-Term Compounding Value

    The match’s compounding effect over time is meaningful. Assuming 8% average annual return:

    • A $210 Gold match (on a $7,000 contribution) grows to approximately $453 after 10 years and $979 after 20 years.
    • A $70 non-Gold match grows to roughly $151 after 10 years and $326 after 20 years.
    • The extra 2% match from Gold adds approximately $650 in compounded value per $7,000 contributed over 20 years (estimated, based on 8% annual return).

    These are estimates based on a constant return assumption. Actual returns will vary.


    Margin Interest Savings and Other Gold Features

    $1,000 Interest-Free Margin

    Gold members receive $1,000 of interest-free margin. Robinhood’s margin rate for balances up to $50,000 was 5% as of March 2026. Carrying $1,000 at 5% annually costs $50 in interest—exactly the cost of the subscription. Any margin balance above the $1,000 free threshold accrues interest at the standard rate.

    This benefit is most relevant to active traders who maintain consistent margin balances. It is not useful if you never trade on margin.

    Robinhood Strategies Fee Cap

    For investors using Robinhood’s managed portfolio service (Robinhood Strategies), Gold members pay management fees only on the first $100,000 of assets. Every dollar above $100,000 is managed at 0% fee. This is a significant benefit for high-balance managed account users, but irrelevant to those who self-direct all trades.

    Morningstar Research Access

    Gold members receive access to professional stock and fund research from Morningstar, including analyst reports, fair value estimates, and star ratings. This is a useful add-on for fundamental investors who would otherwise pay for Morningstar Premium separately (which costs $249/year standalone). For investors who rely primarily on technical analysis or just buy index funds, this benefit has limited practical value.

    Larger Instant Deposits

    Gold members get access to larger instant deposit amounts, allowing faster deployment of deposited funds before the ACH transfer fully clears. Robinhood does not publish the exact limit publicly.


    Calculating Your Personal Break-Even Point

    The subscription costs $50/year (annual billing) or $55 in year one if you go monthly after the free trial ($5 × 11 months). Use the following scenarios to determine whether Gold pays for itself in your specific situation:

    Scenario 1: Cash Focus

    Keep $1,500 or more in uninvested brokerage cash at all times. The extra 1.85% APY (vs. non-Gold) generates approximately $27.75/year on $1,500—not enough alone. You need closer to $2,700 in idle cash for the interest differential to fully cover the $50 subscription. If you maintain $1,500 and also contribute to an IRA or use margin, the math improves quickly.

    Scenario 2: IRA Focus

    Contribute $1,667 or more annually to a Robinhood IRA. The 3% match generates $50.01+, covering the subscription. This is the cleanest, single-feature break-even case.

    Scenario 3: Margin Focus

    Maintain a consistent margin balance of $1,000 or more. Interest-free margin at the current 5% rate saves $50/year—exactly the subscription cost. Balances above $1,000 save proportionally more.

    Scenario 4: Hybrid

    Combine partial value from multiple features. Example: $700 in idle cash (~$13/year extra interest) + $1,000 IRA contribution (~$20 extra match vs. non-Gold) + $500 margin (~$25 saved) = $58/year in combined value, covering the $50 subscription.


    Pros and Cons of Robinhood Gold

    Pros

    • 3% IRA match is unique — no major competing brokerage offers an IRA match for self-directed accounts.
    • Low cost — $5/month or $50/year is a low barrier for what’s offered.
    • 30-day free trial — no financial commitment to test all features.
    • Simple fee structure — flat subscription, no percentage-based fees tied to account size for the primary benefits.
    • Morningstar access — adds standalone research value for stock pickers.

    Cons

    • IRA match has strings attached — 12-month Gold requirement and 5-year hold period are real constraints.
    • Cash APY is not best-in-class — 3.35% APY lags behind high-yield savings accounts offering 5.25%+ with no fees.
    • Margin rates are still high — 5% on balances above the $1,000 free tier is not a bargain rate.
    • Retirement cash excluded — the APY boost does not apply to IRA cash balances.
    • Early IRA match removal fee — withdrawing matched funds within 5 years triggers a fee equal to the match earned on the withdrawn amount.

    Robinhood Gold vs. Alternatives

    Platform Monthly Fee Cash APY IRA Match Margin Rate (up to $50K) Notable Feature
    Robinhood Gold $5/mo ($50/yr) 3.35% 3% (Gold) / 1% (free) 5% (after $1K free) Only broker with IRA match
    Fidelity $0 ~4.33% None Varies Broad fund selection, fractional shares
    E*TRADE (Morgan Stanley) $0 ~4.75% None Varies Advanced tools for active traders
    SoFi Invest $0 Lower None Varies Strong options and margin tools
    HYSA (Ally, Marcus) $0 5.25–5.40% N/A N/A FDIC insured, no minimums

    APY and rate figures are approximate as of early 2026 and subject to change.

    The key takeaway from this comparison: Robinhood Gold’s cash APY is the weakest entry in the table. Its IRA match is the strongest. If your primary goal is maximizing return on idle cash, free alternatives at Fidelity, E*TRADE, or a dedicated HYSA outperform Gold’s 3.35% rate without any subscription fee.

    Robinhood Gold’s defensible edge is the IRA match—a feature that no competing brokerage currently offers for self-directed accounts. If IRA contributions are a regular part of your financial plan and you’re contributing at least $1,667/year, no competitor matches that value for $50/year.


    What to Do Next: A 5-Step Decision Framework

    1. Start the 30-day free trial and audit your usage. During the trial, check: How much uninvested brokerage cash do you typically hold? Do you plan IRA contributions this year? Do you use margin? Honest answers to these three questions determine whether Gold pays for itself.
    2. Run your personal break-even calculation. Use the three scenarios above. If any single scenario generates $50+ in annual value, or if two scenarios combined do, Gold pays for itself. If none do, cancel before the trial ends.
    3. If committing for the IRA match, set a 12-month calendar reminder. Gold membership must be maintained for one year after your first match to keep the full benefit. Canceling early forfeits matched funds. Mark the date so you’re not caught off guard.
    4. If cash is your primary holding, compare HYSA rates before deciding. High-yield savings accounts at Ally, Marcus, or similar banks currently offer 5.25%+ APY with zero fees and full FDIC insurance. If you’re holding significant cash primarily for yield, a free HYSA outperforms Gold on this metric alone.
    5. Revisit the decision annually. Rates change. The 3.35% APY is set at Robinhood’s discretion and has moved with market conditions historically. If the rate gap between Gold and free accounts narrows significantly, reassess whether the subscription still earns its keep.

    Bottom Line

    Robinhood Gold is a focused product with a narrow but genuine value proposition. At $5/month, it does not need to do everything—it needs to do one thing worth $50/year for the right user.

    For IRA investors contributing $1,667 or more annually, the 3% match delivers clear, measurable value unavailable anywhere else in retail self-directed investing. For investors holding $1,500+ in brokerage cash or maintaining margin balances, the subscription can also justify itself—though free alternatives often match or beat the cash APY.

    The honest caveat: if you rarely contribute to an IRA, keep minimal cash on hand, and never use margin, Robinhood Gold is $50/year spent on features you won’t use. The 30-day free trial exists precisely to help you figure out which category you fall into before committing.

    This article is for informational purposes only and does not constitute personalized financial, tax, or investment advice. Rates, fees, and terms are subject to change. Verify current terms directly with Robinhood before making subscription decisions.

  • 401(k) When You Leave a Job: Rollover Guide

    401(k) When You Leave a Job: Rollover Guide


    What Happens to Your 401(k) When You Leave a Job? A Guide to Rollovers and Options

    Leaving a job triggers a decision most people aren’t prepared to make: what to do with the 401(k) balance sitting at your former employer. Make the wrong move — or no move at all — and you could lose 30–40 cents of every dollar to taxes and penalties, or quietly pay hundreds of dollars a year in fees while the account sits untouched.

    You have four options. Each has different tax consequences, fee structures, and long-term tradeoffs. This guide breaks down every path using 2026 rules, including updates under the SECURE 2.0 Act that directly affect rollover thresholds, catch-up contributions, and penalty-free withdrawal access.

    This article is for informational purposes only and does not constitute personalized financial, tax, or legal advice. Consult a qualified professional before making retirement account decisions.


    Your Four Main 401(k) Options When You Leave a Job

    • Leave it with your former employer’s plan — available if your vested balance exceeds $7,000 (the 2026 auto-rollover threshold under SECURE 2.0)
    • Roll it into your new employer’s 401(k) — if the new plan accepts incoming rollovers
    • Roll it into a traditional or Roth IRA — offers the broadest investment options and typically lower fees
    • Cash it out immediately — the least favorable option; most savers lose 30–40% to taxes and penalties

    Option 1: Leave Your 401(k) With Your Former Employer

    If your vested balance exceeds $7,000 (updated from $5,000 under SECURE 2.0 as of 2026), your former employer must keep your account open. You don’t have to do anything right away.

    What stays the same

    • You keep access to the same investment menu available to active employees.
    • The vested employer contributions you’ve already earned remain yours.
    • No required minimum distributions (RMDs) until age 73 under current SECURE 2.0 rules — unless you are a 5% or greater owner of the company.

    What to watch for

    • Administrative fees: Many 401(k) plans charge $100–$300 or more annually in plan administrative costs. Former employees sometimes pay a disproportionate share once they stop contributing.
    • No new contributions: You can’t add money to a plan at a company where you no longer work. The account is frozen in terms of growth from contributions.
    • Investment inertia: Out of sight often means out of mind. Accounts left with former employers frequently receive less attention and can drift out of alignment with your target allocation.

    Best for

    Employees who had access to uniquely low-cost institutional funds (some large-employer plans offer fund expense ratios under 0.05%) and who plan to revisit their retirement consolidation strategy within 12 months.


    Option 2: Roll Into Your New Employer’s 401(k)

    If your new employer’s plan accepts rollovers — not all do — you can transfer your old 401(k) balance directly into your new account. Done correctly as a direct rollover, this creates zero taxable income and no withholding.

    Key benefits

    • Consolidation: One account to track, one statement, one login.
    • Creditor protection: ERISA-governed 401(k) plans offer strong federal creditor protection. IRA protections vary by state, which matters if you carry significant business or legal risk.
    • Loan access: Many 401(k) plans allow loans up to 50% of your vested balance or $50,000, whichever is less. IRAs do not permit loans.
    • Catch-up contributions for ages 60–63: In 2026, employees in this age range can contribute up to $11,250 in catch-up contributions on top of the $24,500 standard limit — a benefit only available in employer plans, not IRAs.

    Restrictions to confirm before you leave

    • Ask HR whether the new plan accepts incoming rollovers and whether there is a waiting period before you can enroll.
    • Review the new plan’s investment menu: if it is limited to high-cost funds, an IRA rollover may be a better fit.

    Best for

    Employees planning a long tenure with the new employer who want simplicity, federal creditor protection, or access to the enhanced 2026 catch-up contribution limits for ages 60–63.


    Option 3: Roll Into an IRA (Widest Flexibility)

    Rolling a former employer’s 401(k) into an Individual Retirement Account gives you the widest control over investments, fees, and withdrawal strategy. This is the most common path for workers who are self-employed, between jobs, or dissatisfied with the investment options in both their old and new plans.

    Traditional IRA rollover

    • Pre-tax 401(k) funds roll into a traditional IRA with no tax event.
    • Funds continue to grow tax-deferred.
    • Withdrawals in retirement are taxed as ordinary income.
    • No income limits apply to a rollover (distinct from annual IRA contribution eligibility rules).

    Roth IRA conversion rollover

    • You can convert pre-tax 401(k) funds to a Roth IRA, but the converted amount counts as ordinary taxable income in the year of conversion.
    • In 2026, a $60,000 rollover-conversion could push you into a higher marginal bracket — model this with a tax professional before initiating the transfer.
    • The tradeoff: all future growth and qualified withdrawals from the Roth IRA are tax-free, making this a powerful strategy for workers in a temporarily low-income year.

    Fee comparison

    Account Type Typical Annual Cost Investment Options
    Employer 401(k) $100–$300+ in admin fees; fund ERs vary Limited to plan menu (typically 15–30 funds)
    IRA at major custodian $0–$50 annually at Fidelity, Vanguard, Schwab Stocks, bonds, ETFs, mutual funds, REITs, and more

    IRA-specific penalty exceptions (not available in 401(k)s)

    • First-time home purchase (up to $10,000 lifetime)
    • Qualified higher education expenses
    • Health insurance premiums while unemployed
    • Disability (substantially equal periodic payments)

    Best for

    Cost-conscious investors who want broad investment access, those in a low-income year considering a Roth conversion, and workers who are self-employed or unlikely to have access to a competitive employer plan.


    Option 4: Cash Out Your 401(k) — The Costly Mistake

    Cashing out is straightforward to execute and almost always the worst financial outcome. The IRS treats the withdrawal as ordinary income and, for most people under age 59½, layers on an additional 10% early-withdrawal penalty.

    What the math actually looks like

    • A $50,000 balance cashed out by someone in the 22% federal bracket: roughly $11,000 in federal income tax + $5,000 early withdrawal penalty = approximately $34,000 in hand. State income taxes reduce this further.
    • That same $50,000 left invested at a 7% average annual return grows to approximately $380,000 in 30 years — without any additional contributions.

    2026 penalty exceptions (limited circumstances)

    • Federally declared natural disasters: Up to $22,000 penalty-free if you live in a declared disaster area.
    • Terminal illness: No 10% penalty for terminally ill individuals.
    • Domestic abuse: Up to $10,000 penalty-free for survivors.
    • Long-term care insurance premiums: Up to $2,500 per year starting in 2026 under SECURE 2.0.
    • Separation from service at age 55+: If you leave your employer in or after the year you turn 55, the 10% penalty does not apply to that employer’s plan (not applicable to IRA rollovers).

    If you are facing genuine financial hardship, explore a 401(k) plan loan (if still employed) or a hardship withdrawal before triggering a full distribution. A full cash-out should be the last resort, not the first response to a job change.


    Tax Implications and Timing: What You Need to Know

    Direct rollover vs. indirect rollover

    The mechanics matter as much as the decision itself.

    • Direct rollover: Your former employer transfers funds directly to the new plan or IRA custodian. You never receive a check. No taxes are withheld. This is the correct approach for virtually everyone.
    • Indirect rollover: You receive a check payable to you. The plan is required to withhold 20% for federal taxes. You have 60 days to deposit 100% of the original balance — including the withheld 20% from your own pocket — into a qualifying account. Failure to deposit the full amount means the withheld portion is treated as a taxable distribution, plus a 10% penalty if you are under 59½. You can reclaim the withheld taxes when you file your return, but only after depositing from savings.

    The 60-day risk

    The IRS grants limited hardship extensions to the 60-day rollover window, but these are not automatic. Missing the deadline is not easily reversed. Always request a direct rollover to eliminate this risk entirely.

    RMD rules at age 73

    Once you reach age 73, the IRS requires annual withdrawals from traditional 401(k)s and IRAs. If you plan to work past 73 and participate in a current employer’s 401(k), you may be able to defer RMDs from that specific plan. Rolling funds to a Roth IRA eliminates RMDs entirely, since Roth IRAs have no lifetime distribution requirements for the original account owner.


    2026 Changes Under the SECURE 2.0 Act: What Affects Your Decision

    Several provisions took effect or were clarified for 2026 that directly influence which 401(k) option makes sense:

    • Standard contribution limit: $24,500 (up from $23,500 in 2025), with a $8,000 catch-up for ages 50–59 and 64+.
    • Super catch-up for ages 60–63: $11,250 in additional catch-up contributions, available only in employer plans — not IRAs. This is a strong incentive to remain in or roll into an employer plan if you are in this age window.
    • Mandatory Roth catch-ups for high earners: Employees aged 50 or older earning more than $145,000 (indexed to inflation) must direct any catch-up contributions to a Roth sub-account within their 401(k) plan, if the plan offers a Roth option. This applies to current plan participation, not rollovers, but affects planning decisions for those staying in an employer plan.
    • Auto-rollover threshold raised to $7,000: If your vested balance is below $7,000 when you leave, your former employer is now permitted to automatically roll your balance into an IRA (previously $5,000). If this happens without your guidance, the IRA may be invested in a low-yield default option. Monitor for this if your balance is in the $5,000–$7,000 range.
    • Emergency savings sub-accounts: Some plans now offer a Roth-designated emergency savings account capped at $2,500, allowing up to four penalty-free, tax-free withdrawals per year. If your former employer’s plan has this feature, leaving the plan means losing access to it going forward.

    How to Match Your Situation to the Right Option

    Situation Best Option Key Reason
    High-income earner focused on investment control IRA rollover Lower fees, broader fund access
    Staying with a new employer long-term, competitive plan Roll into new 401(k) ERISA creditor protection, consolidated accounts
    Ages 60–63, maximizing retirement savings window Roll into new 401(k) Access to $11,250 super catch-up not available in IRAs
    In a low-income year (layoff, career break, sabbatical) Roth IRA conversion Tax cost of conversion is lower; future growth is tax-free
    Balance under $7,000 Monitor for auto-rollover; consider directing it yourself Avoid defaulting into a low-yield auto-rollover IRA
    Concerned about creditors or litigation risk Roll into new 401(k) if available Federal ERISA protection; IRA protection varies by state
    Uncertain about retirement timeline; want withdrawal flexibility IRA rollover More penalty exceptions (first home, education, disability)

    What to Do Next: Action Steps for Your 401(k) Transition

    Most people spend more time choosing a new laptop than handling a 401(k) rollover. These steps take roughly two to four weeks and can prevent a costly mistake.

    Step 1: Request fee and balance documentation within two weeks of leaving

    Contact your former employer’s plan administrator — typically the HR department or a third-party record-keeper like Fidelity or Vanguard — and ask for a current balance statement and Summary Plan Description (SPD). Look specifically for any annual administrative fees charged to terminated participants.

    Step 2: Confirm rollover eligibility with your new employer

    Ask HR two questions: Does the plan accept incoming rollovers? And is there a waiting period before you can enroll? Some plans require 30–90 days of employment before accepting funds. If there is a delay, your old plan account can stay open in the interim.

    Step 3: Compare costs across your options

    Obtain fund expense ratios and plan administrative fees from the new employer’s plan, and benchmark against IRA costs at one or two custodians. Fidelity, Vanguard, and Charles Schwab all offer $0 annual IRA fees and access to low-cost index funds with expense ratios under 0.10%.

    Step 4: Initiate a direct rollover — do not accept a check

    Whether moving to a new 401(k) or an IRA, request a direct trustee-to-trustee transfer. Your former plan will require paperwork; start this process early. Confirm the receiving institution’s wire or check instructions before submitting the rollover request to avoid your funds landing in the wrong place.

    Step 5: If considering a Roth conversion, calculate the tax hit first

    A Roth rollover creates taxable income in the year it is executed. Before you move, estimate the additional tax liability using your expected 2026 adjusted gross income and confirm you have liquid cash available to pay the taxes due at filing — do not use the rollover funds themselves to pay the tax bill, as that reduces your invested balance.

    Step 6: Verify receipt and reallocate investments within 30 days

    Log into your new account after the transfer confirms (typically 3–7 business days for direct rollovers). Confirm the full balance arrived and review the investment allocation. Many rollovers default into a money market or stable value fund — you may need to actively redirect the funds into your target portfolio.


    Bottom Line

    Leaving a job does not automatically put your 401(k) at risk, but doing nothing is still a choice — and often a costly one. For most workers, rolling into an IRA or a new employer’s plan is the right move. The best option depends on your age, income, the quality of each plan’s investment menu, and how much weight you place on creditor protection versus investment flexibility.

    The one option that is almost never optimal: cashing out. The combination of ordinary income taxes and the 10% early withdrawal penalty erases decades of compound growth in a single transaction.

    With the 2026 SECURE 2.0 updates now in effect — particularly the raised auto-rollover threshold, new catch-up rules, and expanded penalty exceptions — the decision is more nuanced than it was even a year ago. Take the time to compare your specific options before the 60-day indirect rollover window forces your hand.

  • Dollar-Cost Averaging vs. Lump Sum Investing

    Dollar-Cost Averaging vs. Lump Sum Investing


    Dollar-Cost Averaging vs. Lump Sum Investing: Which Strategy Builds Wealth Faster?

    You’ve come into $50,000—an inheritance, a bonus, the proceeds from selling a car or a rental property. The money is sitting in your bank account, and now you face a decision that trips up experienced investors as often as it does beginners: deploy it all at once, or spread it out over time?

    This is the dollar-cost averaging (DCA) vs. lump-sum investing debate. Both strategies are widely used, both have legitimate rationales, and the data on which one wins is clear—but incomplete. Here’s what the research actually shows, where each strategy fits, and how to make the right call for your specific situation.

    This article is for informational purposes only and does not constitute personalized financial, tax, or investment advice.


    The Core Debate: Time in the Market vs. Timing the Market

    These two strategies reflect fundamentally different assumptions about how markets work and how much uncertainty an investor is willing to absorb.

    Lump-sum investing deploys all available capital immediately into your target asset allocation. The premise: markets trend upward over time, so the sooner your money is invested, the more it compounds.

    Dollar-cost averaging spreads that same capital across equal installments over weeks, months, or even a year. The premise: by buying at multiple price points, you reduce the damage if you happen to invest right before a market drop.

    The historical data leans decisively in one direction. Vanguard’s research covering U.S., U.K., and Australian market data from 1926 through 2015 found that lump-sum investing outperformed DCA in approximately 68% of rolling 10-year periods in U.S. markets. Morgan Stanley’s analysis of more than 1,000 overlapping seven-year historical periods reached a similar conclusion: lump-sum generated higher annualized returns in 56% of cases.

    The performance edge, however, is often modest—roughly 1.8% to 2.4% annualized advantage depending on the study, time period, and asset allocation examined. That gap matters, but it isn’t the only number worth considering.


    How Dollar-Cost Averaging Works: The Gradual Approach

    Dollar-cost averaging means investing a fixed dollar amount at regular intervals regardless of market conditions. You don’t try to predict whether this month is a good or bad time to buy. You simply invest on schedule.

    A Concrete DCA Example

    Suppose you receive a $50,000 windfall. Instead of investing it on day one, you divide it into 12 equal monthly installments of approximately $4,167 each.

    • Month 1: Market is at 4,800. You buy shares at that level.
    • Month 4: Market drops to 4,400. Your $4,167 buys more shares than it did in Month 1.
    • Month 9: Market recovers to 5,100. You buy fewer shares, but your earlier purchases have appreciated.

    The result is a blended average entry price across the full 12-month period. You avoid the single worst-case scenario—putting everything in on the day before a 20% correction—but you also reduce your upside if markets rise immediately after you start investing.

    Who Uses DCA and Why

    DCA is already the default strategy for most workers contributing to a 401(k). Each paycheck, a fixed amount goes into the market. That’s textbook dollar-cost averaging, and it works well precisely because the contributions are automatic and consistent.

    Where DCA becomes a deliberate choice rather than a structural one is when an investor receives a lump sum and chooses to drip it in over time. The primary appeal is psychological: spreading the investment softens the blow of an immediate paper loss and reduces what behavioral economists call “regret risk”—the sting of investing everything right before a decline.


    How Lump-Sum Investing Works: The All-In Approach

    Lump-sum investing is straightforward: when capital becomes available, you invest it immediately into your target allocation. No waiting, no installment schedule, no attempt to predict short-term market direction.

    A Concrete Lump-Sum Example

    You inherit $50,000 and invest it entirely on day one in a diversified index fund. From that moment, the full $50,000 is exposed to market returns—positive and negative. If the market rises 10% over the next 12 months, you capture that gain on all $50,000, not just the portion you’ve deployed so far.

    This is the core mathematical advantage: more capital working in the market for a longer period of time. Every month your money sits uninvested while you implement a DCA schedule, it is earning cash returns (typically low) rather than equity or bond returns (historically higher over time).

    Why Markets Favor Lump-Sum Most of the Time

    U.S. equity markets have historically been in an uptrend roughly 67% to 75% of calendar years. That means in any given year, the market is more likely to be higher at year-end than at the start. An investor who delays capital deployment into a rising market systematically pays higher average prices than someone who committed the full amount on day one.

    JP Morgan’s analysis of 20-year rolling periods from 1950 to 2020 found that missing just the 10 best market days reduced annualized returns from 9.2% to 5.6%. Dollar-cost averaging doesn’t necessarily cause you to miss the best days, but it guarantees that only a fraction of your capital participates in any strong gains that occur during the deployment window.


    Historical Performance: Lump Sum Wins Most of the Time—But Not Always

    The performance data across multiple studies consistently favors lump-sum, but the margin and frequency of outperformance vary by time period and market conditions.

    RBC GAM Data: S&P/TSX Composite, 1990–2024

    RBC GAM examined average returns from lump-sum vs. various DCA periods for the S&P/TSX Composite Index across consecutive years from January 1990 through October 2024. The lump-sum approach outperformed across every DCA time window studied:

    DCA Period Lump-Sum Average Return DCA Average Return
    3 months 11.5% 6.1%
    6 months 8.5% 4.6%
    9 months 5.5% 3.2%
    12 months 2.7% 1.8%

    Source: RBC GAM, Morningstar. Returns based on monthly total returns. Past performance does not guarantee future results. Returns do not reflect transaction costs, fees, or taxes.

    The shorter the DCA window, the larger the lump-sum advantage in this dataset. A three-month DCA period nearly halved average returns compared to investing immediately.

    When Dollar-Cost Averaging Outperforms

    DCA does win—about one-third of the time historically. The conditions that favor it are specific: markets that trend sideways or decline during the deployment window. If you happened to start investing in October 2007 (the S&P 500’s pre-crisis peak), DCA would have meaningfully outperformed a lump-sum approach over the following 12 months. The problem is you can’t know in advance which scenario you’re entering.

    Morgan Stanley notes that in an aggressive equity-heavy portfolio, the lump-sum approach yielded only about 0.42% higher annualized return over a 12-month DCA window in their simulations—a real but narrow edge. In more moderate allocations, the gap narrows further.


    When Dollar-Cost Averaging Makes Sense

    The data may favor lump-sum on average, but “on average” doesn’t describe every investor or every situation. There are specific conditions under which DCA is the more practical choice.

    Scenario 1: You’re a New Investor

    If you’ve never watched a portfolio drop 25% in a matter of weeks, you don’t actually know how you’ll react. DCA gives you time to calibrate your tolerance before your full capital is exposed. Entering the market gradually also builds the habit of regular investing without creating a single traumatic entry point.

    Scenario 2: The Lump Sum Represents Most of Your Net Worth

    There’s a difference between investing $5,000 you can afford to watch decline and investing $200,000 that represents your retirement safety net. For large relative amounts, the psychological cost of an immediate 20% drawdown is not trivial. CFP Michael Reynolds of Elevation Financial notes that DCA may be appropriate when “the thought of investing everything at once causes significant anxiety”—because anxiety leads to panic selling, which destroys returns.

    Scenario 3: You’re Near Retirement

    Investors within five years of retirement have a shorter recovery window for sequence-of-returns risk. A lump-sum entry into equities right before a major bear market could permanently impair a retirement portfolio. DCA, or a shift toward a more conservative allocation, makes sense here regardless of what the long-run average data says.

    Scenario 4: The Hybrid Approach

    Some investors split the difference by investing 50% immediately as a lump sum and dollar-cost averaging the remaining 50% over 3 to 6 months. This captures some of the lump-sum advantage while reducing regret risk on the portion held back. A more sophisticated version, suggested by 1834 Wealth Management, involves investing the bond allocation immediately (to begin earning income) while phasing equity exposure over several months.


    When Lump-Sum Investing Wins: The Numbers Tell the Story

    If the following conditions describe you, the historical data supports deploying capital as quickly as possible.

    • Time horizon of 10+ years: The longer your investment horizon, the more lump-sum’s compounding advantage accumulates. Short-term volatility becomes statistically irrelevant across multi-decade holding periods.
    • High risk tolerance: You can watch a $50,000 portfolio drop to $38,000 without selling. You don’t check your account weekly. You understand that paper losses in a diversified portfolio are temporary in most historical scenarios.
    • You won’t try to time a re-entry: Investors who DCA sometimes watch markets fall during their deployment window and pause contributions, waiting for a “better” entry point. This defeats the entire purpose and typically results in worse outcomes than either pure strategy.
    • You have an emergency fund separate from the investment capital: Lump-sum investing works best when the money invested won’t be needed for living expenses. If there’s any chance you’ll need to liquidate within two to three years, neither strategy is appropriate for equity markets regardless.

    Northwestern Mutual summarizes the underlying logic clearly: deploying a windfall immediately allows an investor to capture returns on their entire capital from day one. Every week money sits uninvested, it’s forfeiting equity market participation in exchange for cash or money market returns that historically trail inflation over long periods.


    The Psychology Factor: Is the Return Difference Worth the Peace of Mind?

    Here’s the part of the debate that pure performance data can’t fully capture: behavioral risk.

    The average annualized advantage of lump-sum investing over DCA runs approximately 1.8% to 2.4% in modern studies, depending on the asset mix, time window, and market period examined. Over 10 or 20 years, that gap compounds into a meaningful dollar difference. But only if you stay invested.

    An investor who deploys $100,000 as a lump sum and then sells during a 30% bear market—booking a real loss—will fare far worse than an investor who used DCA and held through the same downturn. Behavioral risk, the tendency to sell low in response to fear or panic, destroys far more wealth than a 2% return difference between entry strategies.

    A 2024 flat fee advisors analysis framed it bluntly: “The best investment strategy is the one you’ll stick with.” If DCA keeps you fully invested through bear markets while lump-sum investing would have triggered a panic exit, DCA produces the better real-world result even if it loses on paper in a rising market scenario.

    The honest answer is that most investors don’t know their true risk tolerance until they’ve lived through a severe drawdown. If you’ve never experienced a year like 2008 or early 2020, DCA’s real benefit isn’t the return math—it’s the behavioral scaffolding that keeps you in the market when your instincts tell you to run.


    What to Do Next: Choose Your Strategy Based on These Factors

    Use the following framework to make a deliberate decision rather than defaulting to whichever strategy feels more comfortable in the abstract.

    Step 1: Assess Your Risk Tolerance Honestly

    Ask yourself: if I invest $50,000 today and it drops to $38,000 within six months, what do I do? If your answer involves checking prices daily and seriously considering selling, lump-sum investing will likely hurt you in practice. DCA or a hybrid approach is the better fit.

    Step 2: Calculate Your Investment Horizon

    • 10+ years: Lump-sum’s compounding advantage is most powerful. Historical data strongly favors immediate deployment.
    • 5–10 years: Both strategies are viable. The return difference narrows, and risk management becomes more important relative to maximizing upside.
    • Under 5 years: Equity exposure may not be appropriate regardless of entry strategy. Consider your asset allocation before the entry timing question.

    Step 3: Consider the Dollar Amount

    • Under $10,000: Lump-sum is typically fine. The psychological weight of a loss is lower, and the compounding difference from delay is meaningful relative to the total amount.
    • $10,000–$100,000: Either strategy works. Your risk tolerance and time horizon should drive the decision.
    • Over $100,000: DCA or a hybrid approach is worth considering, especially if this represents a large share of your investable assets. The absolute dollar value of a 20% loss is significant enough to create real behavioral risk.

    Step 4: Try the Hybrid Approach If You’re Unsure

    The 50/50 split—deploy half immediately, DCA the other half over three to six months—is not mathematically optimal, but it’s a reasonable compromise for investors who are genuinely uncertain. It captures a portion of lump-sum’s advantage while reducing the emotional exposure of a full immediate commitment.

    A more structured hybrid: invest your full bond and fixed-income allocation immediately (to capture income and avoid delays in a segment where timing matters less), and use DCA for the equity portion over three to twelve months.

    Step 5: Automate and Commit

    Whichever strategy you choose, automate it. Set the schedule and don’t monitor prices during the deployment period. The single most reliable predictor of investment outcomes isn’t strategy selection—it’s consistent execution over time without emotional interference.


    Bottom Line

    The data is clear and consistent: lump-sum investing has outperformed dollar-cost averaging in roughly two-thirds of historical rolling periods across major equity markets. The mathematical logic is sound—markets trend up over time, so more capital deployed earlier captures more of that upside.

    But “mathematically superior on average” isn’t the same as “right for you.” Dollar-cost averaging exists because real investors face real psychological challenges, and an emotionally manageable strategy that you execute completely will outperform an optimal strategy you abandon during a 30% drawdown.

    If you have a long time horizon, high risk tolerance, and the discipline to ignore short-term volatility: deploy the lump sum now. If you’re new to investing, risk-averse, or working with capital that represents a large share of your net worth: DCA over three to twelve months, or use a hybrid approach. Either way, the most important decision isn’t lump-sum vs. DCA—it’s getting invested and staying invested.

  • Best High-Yield Savings Accounts (HYSA) 2026

    Best High-Yield Savings Accounts (HYSA) 2026


    What Is a High-Yield Savings Account (HYSA) and How to Choose the Best One?

    If your savings are sitting in a traditional bank account earning 0.01% APY, you are leaving real money on the table. As of April 2026, the top high-yield savings accounts (HYSAs) are paying 4.0%–5.0% APY—meaning $10,000 in the right account earns roughly $500 per year instead of $1. That difference compounds every single day.

    This guide covers exactly what a high-yield savings account is, how interest and APY actually work, what to compare before opening one, and which situations HYSAs are—and are not—the right tool for.

    This article is for informational purposes only and does not constitute personalized financial, tax, or legal advice.

    What Is a High-Yield Savings Account (HYSA)?

    A high-yield savings account is a federally insured deposit account that pays a significantly higher interest rate than a standard savings account. The national average APY on traditional savings accounts sits between 0.01% and 0.05%. Top HYSAs offer rates roughly 80 to 100 times higher than that.

    Key characteristics of an HYSA:

    • Higher APY: Rates of 4.0%–5.0% are common among top online banks and fintechs as of April 2026.
    • FDIC-insured: Deposits are protected up to $250,000 per depositor, per insured bank, per ownership category—the same federal protection as any standard bank account.
    • Fully liquid: You can withdraw funds at any time without penalty, unlike certificates of deposit (CDs).
    • Daily compounding: Most HYSAs compound interest daily, meaning your earnings begin generating their own earnings immediately.
    • Primarily online: Online banks and fintech platforms dominate the top-rate market because their lower overhead allows them to pass savings to depositors.

    HYSAs are not investment accounts. Your principal is not at risk from market movements. The trade-off is that returns are capped by the prevailing interest rate environment and will not outpace inflation over long time horizons the way diversified stock investments can.

    How High-Yield Savings Accounts Work: APY and Compounding

    APY vs. Interest Rate

    Banks advertise savings accounts using APY (annual percentage yield), not a flat interest rate. APY is the more accurate number—it reflects your actual return over one year including the effect of compound interest. A 5.00% stated interest rate compounded daily produces a slightly higher effective APY than the same rate compounded monthly.

    When comparing accounts, always use APY as your benchmark, not the base rate.

    How Daily Compounding Works

    With daily compounding, the bank calculates interest on your balance every day and adds it to your account. The next day, interest is calculated on a slightly higher balance. Over time, this snowball effect accelerates your earnings—modestly over short periods, but meaningfully over years.

    A concrete comparison based on a $10,000 deposit held for one year:

    • Traditional savings at 0.05% APY: Earns approximately $5 per year
    • HYSA at 5.00% APY: Earns approximately $500 per year
    • Difference: $495 more in earnings on the same $10,000 balance

    Variable Rates and the Fed Connection

    HYSA rates are variable. They move with the Federal Reserve’s benchmark interest rate. When the Fed raises rates, HYSAs typically follow upward. When the Fed cuts, rates drop.

    As of April 2026, rates have stabilized or seen modest declines from their 2023–2024 peaks. If economic conditions soften further in 2026, additional Fed cuts could push HYSA rates lower. There is no lock-in protection—unlike a CD, your HYSA rate can change at any time.

    Key Factors to Consider When Choosing a High-Yield Savings Account

    APY gets most of the headlines, but it is only one of several variables that determine which account is actually best for your situation.

    1. Actual APY After Conditions

    Many banks advertise a top-tier rate that only applies when specific requirements are met—such as a minimum monthly direct deposit of $500+, a minimum account balance of $5,000, or linking an active checking account. If you cannot meet those conditions, the effective rate may drop to 0.25%–1.0%.

    Before applying, verify whether the advertised APY is unconditional or contingent on qualifying activities.

    2. Fees

    Monthly maintenance fees of $5–$10 can meaningfully erode interest earnings, especially on smaller balances. Look for accounts with:

    • No monthly maintenance fee
    • No minimum balance fee
    • No inactivity fee
    • No excess withdrawal fee (post-2020 regulatory changes eliminated the 6-withdrawal-per-month federal limit, though some banks still impose their own caps)

    3. Minimum Opening Deposit

    Many top online HYSAs require $0 to open. Some require a small initial deposit of $1–$100. A few premium-rate accounts require $5,000–$25,000 to earn the highest tier. Know the threshold before applying.

    4. Digital Accessibility and Transfers

    Confirm the institution offers a functional mobile app, online transfers, and responsive customer support. Also verify transfer speeds—funds typically take 1–3 business days to transfer between banks. Some institutions offer same-day or next-day transfers, which matters if you need quick access to cash.

    5. FDIC Insurance Confirmation

    Verify that the bank is FDIC-insured (or NCUA-insured for credit unions) before depositing. You can confirm FDIC status through the FDIC’s BankFind tool at fdic.gov. This is especially relevant for newer fintech platforms that may partner with an FDIC-insured bank rather than holding the insurance directly.

    6. Rate Transparency

    Is the rate fixed for a promotional period, or is it permanently variable? Some institutions offer an introductory bonus rate for 3–12 months before reverting to a lower standard rate. Others offer a true ongoing variable rate. Understand which you are getting.

    Best Use Cases for High-Yield Savings Accounts

    HYSAs excel in specific financial situations. They are not a universal solution.

    Where HYSAs Make Sense

    • Emergency fund: The standard recommendation is 3–6 months of essential living expenses in liquid, accessible savings. An HYSA earns meaningfully more than a checking or traditional savings account while keeping funds available on short notice.
    • Short-term savings goals (6–24 months): Down payments on homes or vehicles, upcoming weddings, planned vacations, or home renovation projects are all strong use cases. The time horizon is too short for stock market volatility, but long enough to benefit from compounding at 4%+.
    • Storing windfalls: Tax refunds, year-end bonuses, inheritance, or proceeds from selling an asset benefit from temporary HYSA storage while you decide how to deploy the funds. The account earns interest while preventing impulsive spending.
    • Supplemental savings buffer: Keeping savings separate from checking reduces the temptation to spend. An HYSA at a different institution adds a small psychological barrier and earns more in the process.

    Where HYSAs Are Not the Right Tool

    • Long-term retirement savings: Broad stock market index funds have historically returned 8–10% annually over long periods. A 4–5% HYSA rate does not justify using one as a primary retirement vehicle for money you will not need for 10+ years.
    • Money you will spend within 30–60 days: For very short holding periods, the interest earned is negligible. Keep operational spending funds in your checking account for convenience.
    • Inflation-beating wealth accumulation: During periods when inflation exceeds 4–5%, HYSA returns may not keep pace with rising costs in real terms. HYSAs preserve purchasing power better than traditional accounts but are not a growth engine.

    HYSA vs. Traditional Savings, Money Market Accounts, and CDs

    Account Type Typical APY (April 2026) Liquidity Minimums FDIC/NCUA Insured
    Traditional Savings 0.01%–0.05% Full access Low or none Yes
    High-Yield Savings (HYSA) 4.0%–5.0% Full access Often $0 Yes
    Money Market Account 3.5%–4.5% Full access; may include checks/debit Often $2,500+ Yes
    CD (12-month) 4.5%–5.5% Locked until maturity; early withdrawal penalty Varies ($500–$1,000+) Yes
    Stock/Bond Investments Historically 8–10% (stocks); varies widely Liquid but value fluctuates Varies No

    HYSA vs. Money Market: Money market accounts often require higher minimum balances ($2,500 or more) to earn competitive rates and may offer check-writing privileges. APYs are currently similar to HYSAs, but HYSAs generally have lower barriers to entry.

    HYSA vs. CDs: CDs can offer slightly higher guaranteed rates in exchange for locking your funds for 3–60 months. If you withdraw early, you typically forfeit 60–150 days of interest. HYSAs give up a small rate advantage in exchange for full flexibility—a worthwhile trade for most emergency fund and short-term savings use cases.

    HYSA vs. Stocks: Stocks offer higher long-term return potential but introduce principal risk and volatility. Money needed within 1–3 years should generally not be in equities.

    How to Open a High-Yield Savings Account in 5 Steps

    Opening an HYSA takes 10–15 minutes for most online banks. Here is the standard process:

    1. Research and compare options. Use rate-comparison resources to review HYSAs by APY, fees, minimum deposit, and transfer speed. Narrow your list to 3–5 accounts that meet your baseline criteria (no fees, FDIC-insured, competitive APY without unreachable conditions).
    2. Apply online. Visit the bank’s official website and start the application. Most online banks process applications instantly or within a few hours. Have the following ready before you begin.
    3. Provide required documents. Standard requirements include:

      • Valid government-issued photo ID (driver’s license or passport)
      • Social Security number (SSN) or Individual Taxpayer Identification Number (ITIN)
      • Proof of U.S. address (a recent utility bill or mortgage statement)
    4. Fund the account. Link your existing checking or savings account and initiate an electronic transfer. Most banks require $0–$100 to open, though some may require more for their highest APY tiers. Transfers typically settle in 1–3 business days.
    5. Set up automatic contributions. Direct deposit splits or recurring monthly transfers remove the friction of manual saving. Some banks also unlock a higher APY tier when you establish a qualifying direct deposit—check the terms for your specific account.

    Watch Out for Conditional Rates and Hidden Fees

    The most common mistakes when choosing an HYSA involve taking advertised rates at face value. Here is what to scrutinize before committing.

    Conditional APY Requirements

    Some of the highest advertised rates are only available if you meet one or more qualifying criteria, such as:

    • Receiving a direct deposit of $500 or more per month
    • Maintaining a minimum average daily balance of $5,000 or more
    • Opening and actively using a linked checking account
    • Making a minimum number of debit card transactions per month

    If you cannot meet those conditions, the effective APY may be 0.25%–1.5% lower than advertised. For a $10,000 balance, the difference between 4.75% and 1.0% APY is roughly $375 per year in lost earnings.

    True unconditional rates of 4.5%–5.0% do exist at some online banks—they simply require more digging to find.

    Fee Structures to Avoid

    • Monthly maintenance fees ($5–$10/month): A $10/month fee costs $120/year, eliminating most of the interest earned on a small balance at any rate.
    • Inactivity fees: Some institutions charge a fee if no transactions occur within 90–180 days. Read the fee schedule carefully.
    • Excess withdrawal fees: The federal 6-withdrawal-per-month limit was eliminated in 2020, but some banks still impose their own limits. Accounts that cap withdrawals at 3–6 per month can reduce your flexibility.

    Promotional vs. Ongoing Rates

    Verify whether the stated APY is a limited-time promotional offer. Some banks advertise a high introductory rate (e.g., 5.00% for 6 months) that drops to a lower standard rate (e.g., 3.25%) afterward. If you plan to hold savings long-term, the ongoing rate matters more than the promotional one.

    What to Do Next: Your Action Plan

    If you are ready to move your savings into a higher-earning account, work through these steps in order:

    1. Define your savings goal. Are you building an emergency fund, saving for a short-term purchase, or parking a windfall? Your goal determines your required balance and how important instant liquidity is.
    2. Calculate a target amount. Emergency funds: aim for 3–6 months of essential monthly expenses (housing, food, utilities, transportation, minimum debt payments). For specific goals, use the full anticipated cost as your target.
    3. Compare 3–5 top HYSAs. For each account, verify: the actual APY you will receive given your likely balance and deposit behavior, any fees, the minimum opening deposit, and whether the bank is FDIC-insured.
    4. Open your account. The online application takes 10–15 minutes. Have your ID, SSN, and a linked funding account ready. Some institutions offer a $50–$200 sign-up bonus for opening and maintaining a minimum balance—factor that in when comparing options.
    5. Automate your contributions. Set up a recurring monthly transfer from your checking account or split your payroll direct deposit. Automation removes the decision friction that causes people to delay saving.
    6. Revisit your rate every 12 months. HYSA rates fluctuate with Fed policy. An account paying 4.5% today may pay 3.0% a year from now if conditions change. Checking comparable rates annually takes 15 minutes and can recover meaningful earnings if switching is warranted.

    Bottom Line

    A high-yield savings account is one of the most straightforward upgrades available to any saver. On a $20,000 emergency fund, the difference between 0.05% APY (traditional savings) and 4.5% APY (top HYSA) is roughly $890 per year in additional interest—with no added risk, no lock-up period, and no complex management required.

    The key is moving past the headline APY and evaluating the full picture: actual rate after conditions, fee structure, minimum requirements, and FDIC coverage. The best HYSA is the one that pays a competitive, unconditional rate with no fees and frictionless access to your funds.

  • Term vs Whole Life Insurance: 2026 Cost Breakdown

    Term vs Whole Life Insurance: 2026 Cost Breakdown


    Term Life vs Whole Life Insurance: Cost Breakdown and Why Millionaires Choose Term Coverage in 2026

    Most people assume that wealthy individuals buy the most expensive, feature-rich life insurance available. The data says otherwise. In 2026, a large share of high-net-worth individuals—including many with eight-figure portfolios—rely primarily on term life insurance for coverage. The reason is structural: term policies deliver massive death benefits at a fraction of the cost of whole life, freeing capital for investments that outperform insurance-based savings vehicles.

    This article breaks down exactly how term and whole life insurance work, what each costs by age and coverage level, when each product makes sense, and why the math behind “buy term and invest the rest” still holds in 2026. Rates cited are current estimates based on available 2026 industry data; your actual premium will depend on your age, health classification, and carrier.


    The Affordability Gap: Why Millionaires Still Choose Term Life

    The cost difference between term and whole life insurance is not marginal—it is structural. For identical death benefit amounts, term premiums run roughly 7 to 15 times less than whole life premiums in 2026. That gap creates a leverage opportunity that high-net-worth individuals use deliberately.

    A healthy 35-year-old nonsmoker can secure a $500,000 20-year term policy for under $25 per month. A whole life policy with an equivalent death benefit costs several hundred dollars per month from most major carriers. For someone needing $5 to $10 million in coverage—a realistic figure for a business owner or estate with illiquid assets—term premiums run from several hundred to a few thousand dollars per month. Permanent equivalents for the same death benefit can cost 10 to 20 times more.

    For a $2 to $3 million term policy, a healthy 30- to 40-year-old typically pays $150 to $300 per month in 2026 (estimates from current market data). The whole life equivalent requires a premium many times larger to fund the same benefit. That premium difference, redirected into a brokerage account, is the foundation of the wealth-building argument for term coverage.

    High-net-worth individuals also use term strategically for estate liquidity. When a portfolio holds illiquid assets—real estate, a private business, a concentrated stock position—a large, affordable term policy ensures heirs can cover estate taxes or fund a buyout without a forced sale. Term accomplishes that without tying up capital inside an insurance contract.


    What Is Term Life Insurance?

    Term life insurance provides a death benefit for a defined period—typically 10, 20, or 30 years. If the insured dies during that period, beneficiaries receive the full policy amount income-tax-free. If the term expires and no claim is made, the policy ends with no residual value.

    Core Features

    • Fixed-period protection: You choose the term length to match a specific liability—a 30-year mortgage, a 20-year child-rearing window, or a 10-year business loan.
    • No cash value: There is no savings component. Premiums pay only for the death benefit and administrative costs, which is why premiums are low.
    • Guaranteed death benefit: The payout is fixed at policy inception and does not fluctuate with market conditions or interest rates.
    • Convertibility riders: Most term policies include the option to convert to a permanent policy without a new medical exam—useful if your health declines and you later need lifetime coverage.
    • Simplified underwriting: Fewer product features mean faster approval. Many carriers now offer accelerated underwriting for qualifying applicants, sometimes without a paramedical exam.

    What Is Whole Life Insurance?

    Whole life insurance provides coverage for life, as long as premiums are paid. It adds a cash value component—a tax-deferred savings account that grows inside the policy and can be accessed through loans or withdrawals.

    Core Features

    • Guaranteed lifetime coverage: The death benefit is permanent. There is no expiration date, and coverage cannot be canceled as long as premiums are paid.
    • Cash value accumulation: In 2026, most participating whole life policies from mutual insurers guarantee between 1% and 3.5% annual growth on cash value. Overall returns—when non-guaranteed dividends are factored in—may be higher, but those dividend payments are not contractually promised. While interest rates are higher than in the early 2020s, making cash accumulation modestly more attractive, guaranteed growth alone remains well below typical long-term market benchmarks.
    • Policy loans and withdrawals: You can borrow against the cash value without surrendering the policy. Loans are not taxable events, though unpaid loan balances reduce the eventual death benefit.
    • Level premiums: The monthly cost is fixed at issuance and never increases, regardless of age or health changes over the following 40-plus years.
    • Dividend potential: Participating policies from mutual insurers may distribute dividends based on company performance. Dividends are not guaranteed, but some carriers have paid them for over 100 consecutive years.

    2026 Term Life Cost Breakdown: Actual Rates by Age and Coverage Amount

    The following figures are average monthly estimates for nonsmoking applicants on a 20-year term policy, sourced from current 2026 market data (MoneyGeek, Ramsey Solutions). Actual rates vary by carrier, health classification, state, and underwriting outcome.

    Coverage Amount vs. Monthly Premium (40-Year-Old Nonsmoker, 20-Year Term)

    Coverage Amount Female (Avg. Monthly) Male (Avg. Monthly)
    $250,000 $28 $35
    $500,000 $47 $59
    $1,000,000 $86 $109
    $2,000,000 $168 $216
    $3,000,000 $243 $315

    Source: MoneyGeek 2026 term life rate analysis. Rates are averages across multiple carriers and assume standard health classification.

    Key Rate Drivers to Know Before You Apply

    • Age: A 25-year-old pays roughly 35% less per month than a 40-year-old for the same policy. The cost penalty for delay is steep: a 60-year-old male applying for a $500,000 20-year term policy pays more than six times what a 40-year-old male pays for identical coverage. The same six-times-plus multiplier applies to female applicants in the same scenario. Buying early locks in low rates for the full term length.
    • Gender: Female applicants average 10 to 20% lower premiums than male applicants at identical age, term, and coverage amounts, reflecting actuarial life expectancy differences.
    • Smoking status: Smoking adds $101 to $135 per month to a 40-year-old’s 20-year term premium—the single largest per-factor cost driver identified in 2026 market data. Most carriers require nicotine testing regardless of self-reported cessation.
    • Term length: A 30-year term costs $48 to $63 more per month than a 10-year term for the same 40-year-old applicant at $500,000 coverage.
    • Health classification: Pre-existing conditions, elevated BMI, and family history of cardiac disease or cancer can move an applicant from “preferred plus” to “standard” or “substandard,” increasing premiums substantially.
    • Occupation and hobbies: Pilots, construction workers, and individuals with high-risk hobbies such as skydiving or rock climbing face higher premiums or exclusion riders.

    Why Millionaires and High-Net-Worth Individuals Choose Term Coverage

    The assumption that wealthy people buy whole life because they can afford it misses how high-net-worth individuals actually think about capital deployment. Life insurance is a tool with a specific job—replacing income, covering liabilities, or providing estate liquidity. Term does that job at a fraction of the cost.

    Preserving Capital for Higher-Return Investments

    A business owner who needs $5 million in coverage to protect a buy-sell agreement can pay an estimated $500 to $1,000 per month in term premiums rather than $5,000 to $10,000 per month (or more) for a permanent equivalent. The several thousand dollars per month saved goes into equity investments, real estate, or the business itself—assets with historical return potential that substantially exceeds the 1–3.5% guaranteed cash growth typical of whole life policies, even when non-guaranteed dividends are considered.

    Business Continuity and Key-Person Coverage

    Term policies are well-matched to business timelines. A 15- or 20-year term covering a buy-sell agreement or a key-person arrangement aligns with the lifecycle of most businesses without requiring permanent capital commitment. If the business is sold or the key person retires before the term ends, coverage can be dropped without residual obligations.

    Tax-Efficient Death Benefit Transfer

    Term death benefits pass to beneficiaries income-tax-free under current IRS rules. There are no policy loans to unwind, no surrender charges, and no cash value income tax complications. For straightforward income replacement or estate liquidity, the tax treatment is clean and direct.

    The Layered Approach

    Many wealthy individuals do not choose one product exclusively. A common structure combines large-face-value term policies for income replacement and business obligations with a smaller whole life or second-to-die permanent policy for estate equalization or funding an irrevocable life insurance trust (ILIT). Term handles the heavy lifting affordably; permanent coverage handles specific long-horizon estate needs.

    Flexibility as Wealth Grows

    As net worth increases, the need for external life insurance decreases—a concept called self-insurance. A family with $10 million in liquid assets may not need a $3 million death benefit when they reach their mid-60s. Term coverage expires naturally at that point, or can be dropped earlier without penalty. Whole life locks in premiums and capital for life.


    The “Buy Term and Invest the Rest” Strategy: Does It Still Work in 2026?

    The BTIR argument is straightforward: because term premiums are dramatically lower, the premium difference—when actually invested—compounds at market rates that historically far exceed whole life’s guaranteed cash growth. In 2026, higher interest rates have made whole life’s cash accumulation modestly more attractive than it was in the 2015–2021 low-rate environment, but the long-term math still favors disciplined investing.

    The Numbers

    A 40-year-old male buys a 20-year, $500,000 term policy for approximately $59 per month. A comparable whole life policy might cost $400 to $500 per month or more depending on carrier and design. The monthly difference—call it $400—invested in a broad S&P 500 index fund at a historically conservative 8% average annual return produces approximately $235,000 over 20 years. Whole life’s guaranteed cash growth of 1–3.5% annually on that same $400 per month produces far less, particularly given the front-loaded cost structure of most whole life policies, where cash value builds slowly in early years. Even when non-guaranteed dividends are included, whole life’s total illustrated returns historically trail diversified equity investment over comparable horizons.

    The critical caveat: BTIR only works if the difference is actually invested. Individuals who buy term but spend the savings—rather than invest them—end up with no coverage after the term expires and no accumulated wealth. The strategy requires discipline.

    Liquidity Matters

    Brokerage investments are accessible without loan applications, surrender periods, or impact on a death benefit. Whole life cash value access requires a policy loan or withdrawal, which can reduce the death benefit and may have tax implications if the policy lapses while a loan is outstanding. For investors who value flexibility, the BTIR approach keeps assets accessible.


    When Whole Life Insurance Makes Sense

    Whole life is not the right product for everyone, but it solves specific problems that term cannot address.

    Estate Equalization

    Consider a family where one heir inherits an illiquid business and another inherits cash equivalents. A permanent policy—guaranteed to pay regardless of when the insured dies—can ensure the non-business heir receives a comparable inheritance without forcing a business sale. Term insurance cannot reliably serve this function because the insured may outlive the policy.

    Permanent Dependents

    Families with a child who has a severe disability or a dependent who will require lifelong financial support need a policy that does not expire. Term coverage ends. If the dependent outlives the term, coverage is gone. Whole life guarantees a payout regardless of timing.

    Estate Tax Liquidity for Very Large Estates

    In 2026, the federal estate and gift tax exemption stands at $15 million per individual—or $30 million for a married couple—with annual inflation adjustments beginning in 2027. Estates above that threshold may need immediate liquidity to pay the federal tax bill without liquidating illiquid assets. An ILIT funded with a permanent policy—owned outside the taxable estate—can provide that liquidity on demand, without the risk of coverage expiring before it is needed.

    Pension and Income Supplement

    High-income earners who have maximized 401(k) and IRA contributions sometimes use whole life as an additional tax-deferred accumulation vehicle. The tax treatment of cash value growth and the tax-free access via policy loans can complement a broader retirement income strategy. This use case is more relevant as income grows; it is rarely the right first choice for a buyer under age 50.


    Key Factors That Impact Your 2026 Term Life Premium

    If you are ready to price a term policy, here are the variables that will determine what you pay—and what you can control before applying.

    • Apply early. Age is the dominant pricing factor. A 25-year-old pays roughly 35% less than a 40-year-old for the same policy, and the penalty compounds with every passing year. A 60-year-old male can pay more than six times what a 40-year-old male pays for a $500,000 20-year term policy—waiting is expensive in quantifiable terms.
    • Quit smoking—and document it. Nonsmokers pay 50 to 60% less than smokers. Most carriers require 12 months of nicotine-free status, confirmed by testing, before reclassifying an applicant as a nonsmoker.
    • Get your health metrics in order. Blood pressure, cholesterol, BMI, and blood glucose levels all feed into health classification. Applicants who apply when their health metrics are strong lock in lower rates for the full term.
    • Disclose high-risk activities accurately. Undisclosed hazardous hobbies or occupations can lead to policy rescission at claim time. Accurate disclosure ensures the policy performs as intended.
    • Use the conversion window strategically. If there is any chance you will want permanent coverage later, choose a term policy with a conversion rider and convert while your health is still good. Once the conversion window closes—or if your health declines significantly—the option may disappear.
    • Match the term to your actual liability horizon. A 30-year mortgage argues for a 30-year term. A business buyout with a 10-year earn-out argues for a 10-year term. Avoid paying for coverage that extends well beyond the liability it protects.

    Term vs. Whole Life: Quick Comparison

    Feature Term Life Whole Life
    Coverage duration 10, 20, or 30 years Lifetime (while premiums paid)
    Relative cost Low (7–15x cheaper) High
    Cash value None Yes; guaranteed 1–3.5% growth, plus non-guaranteed dividends
    Premium stability Fixed for term length Fixed for life
    Convertibility Usually available via rider N/A
    Best for Income replacement, debt coverage, business continuity Estate planning, permanent dependents, tax-sheltered accumulation

    What to Do Next

    Life insurance decisions hinge on your specific income, dependents, liabilities, and time horizon. Here are concrete next steps based on where you are:

    • If you have dependents and no policy: Get a term quote this week. A 20-year term at 10 to 12 times your annual income is the standard starting point. Delay costs money—locking in a rate at 35 is meaningfully cheaper than waiting until 40, and dramatically cheaper than waiting until 60.
    • If you are evaluating BTIR: Run the math against your actual investment behavior. If you will invest the premium difference monthly and consistently, BTIR works. If you will spend it, reconsider.
    • If your estate exceeds $15 million (or $30 million as a married couple): Federal estate tax exposure is now a real planning variable. Consult an estate planning attorney alongside your insurance review. The right product mix—term, permanent, or both—depends on your estate structure, business interests, and liquidity available to pay potential taxes.
    • If you are considering whole life: Request an illustration showing the guaranteed and non-guaranteed columns separately. Focus on the guaranteed internal rate of return—not projected dividends—to make an accurate comparison with outside investment alternatives. Guaranteed growth typically runs 1–3.5% annually; total illustrated returns incorporating dividends are higher but not contractually promised.
    • If you have an existing term policy with a conversion rider: Check the conversion deadline now, especially if your health has changed. Missing the window eliminates the option permanently.

    This article is for informational purposes only and does not constitute personalized financial, tax, or legal advice. Consult a licensed insurance professional and financial advisor for guidance specific to your situation. Premium figures cited are 2026 market estimates and will vary by carrier, health classification, state, and individual underwriting outcome.